All features
What the dashboard shows you once your exports are in, and what you can do with it. All of it is free.
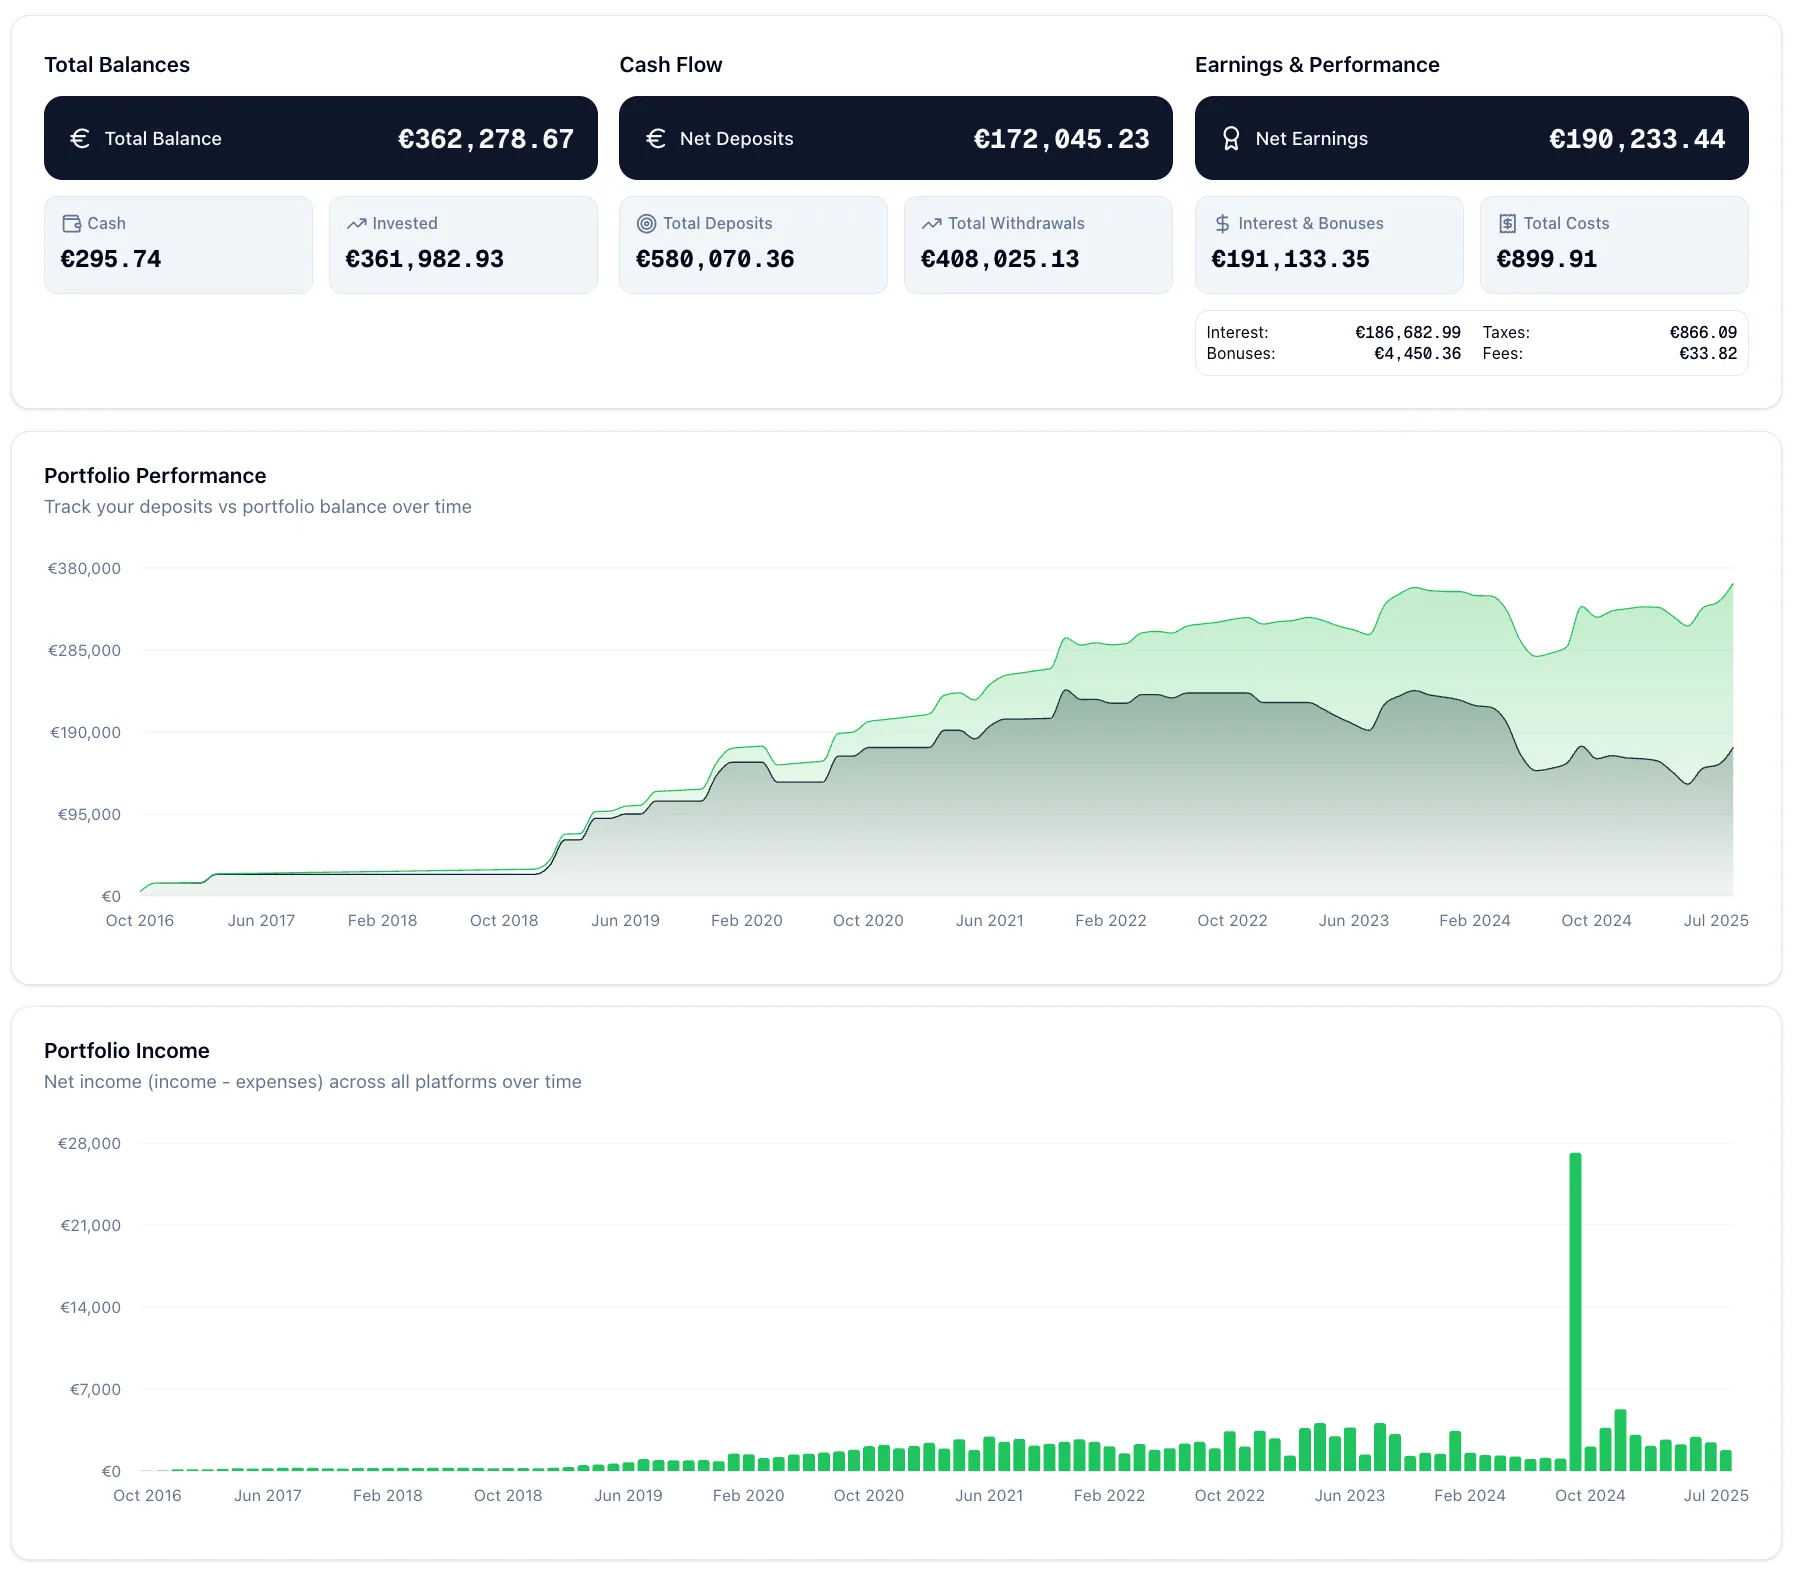
All platforms on one page
Balance, income and return for every platform and for the whole portfolio. Month by month, year by year, back to your first deposit.
- Balance over time, per platform and in total
- Interest, fees and income per month and year
- Charts you can click into
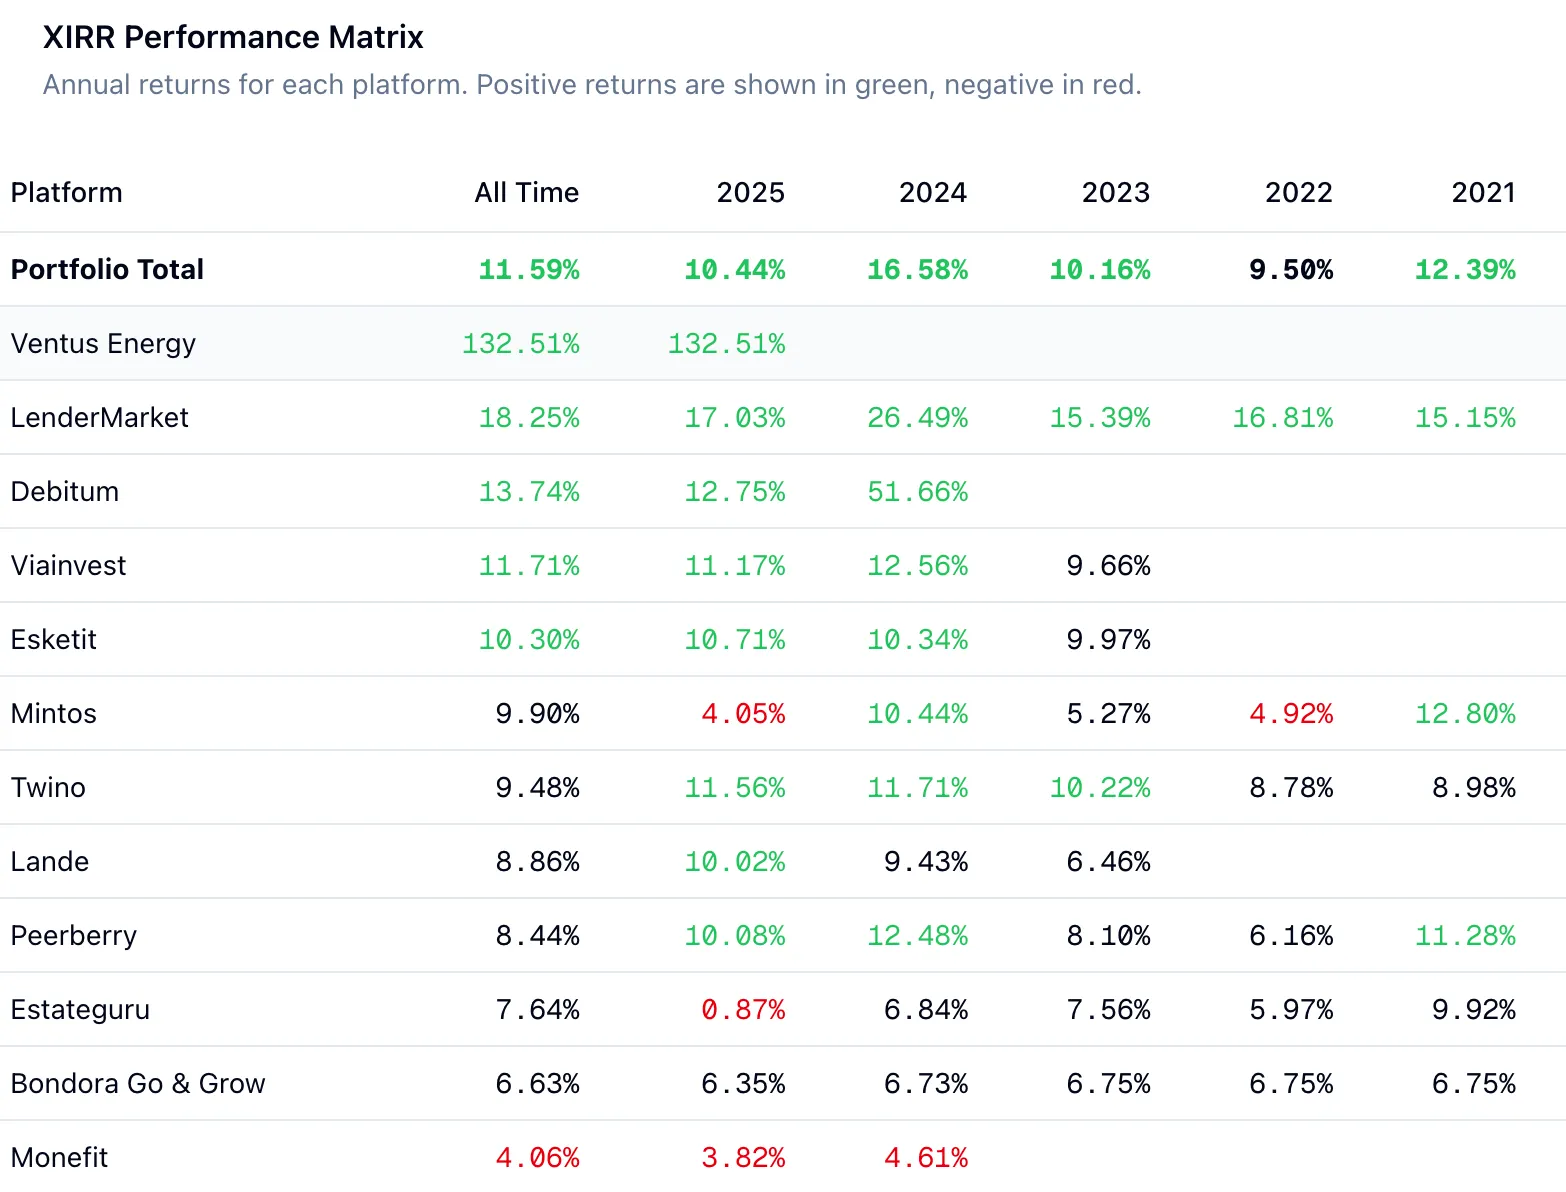
XIRR: the return you actually made
Platforms show the interest rate of the loans. XIRR takes every deposit, withdrawal and payout with its date and works out what your money really earned per year.
- XIRR per platform, so platforms become comparable
- One XIRR for the whole portfolio
- Same method as the XIRR function in Excel
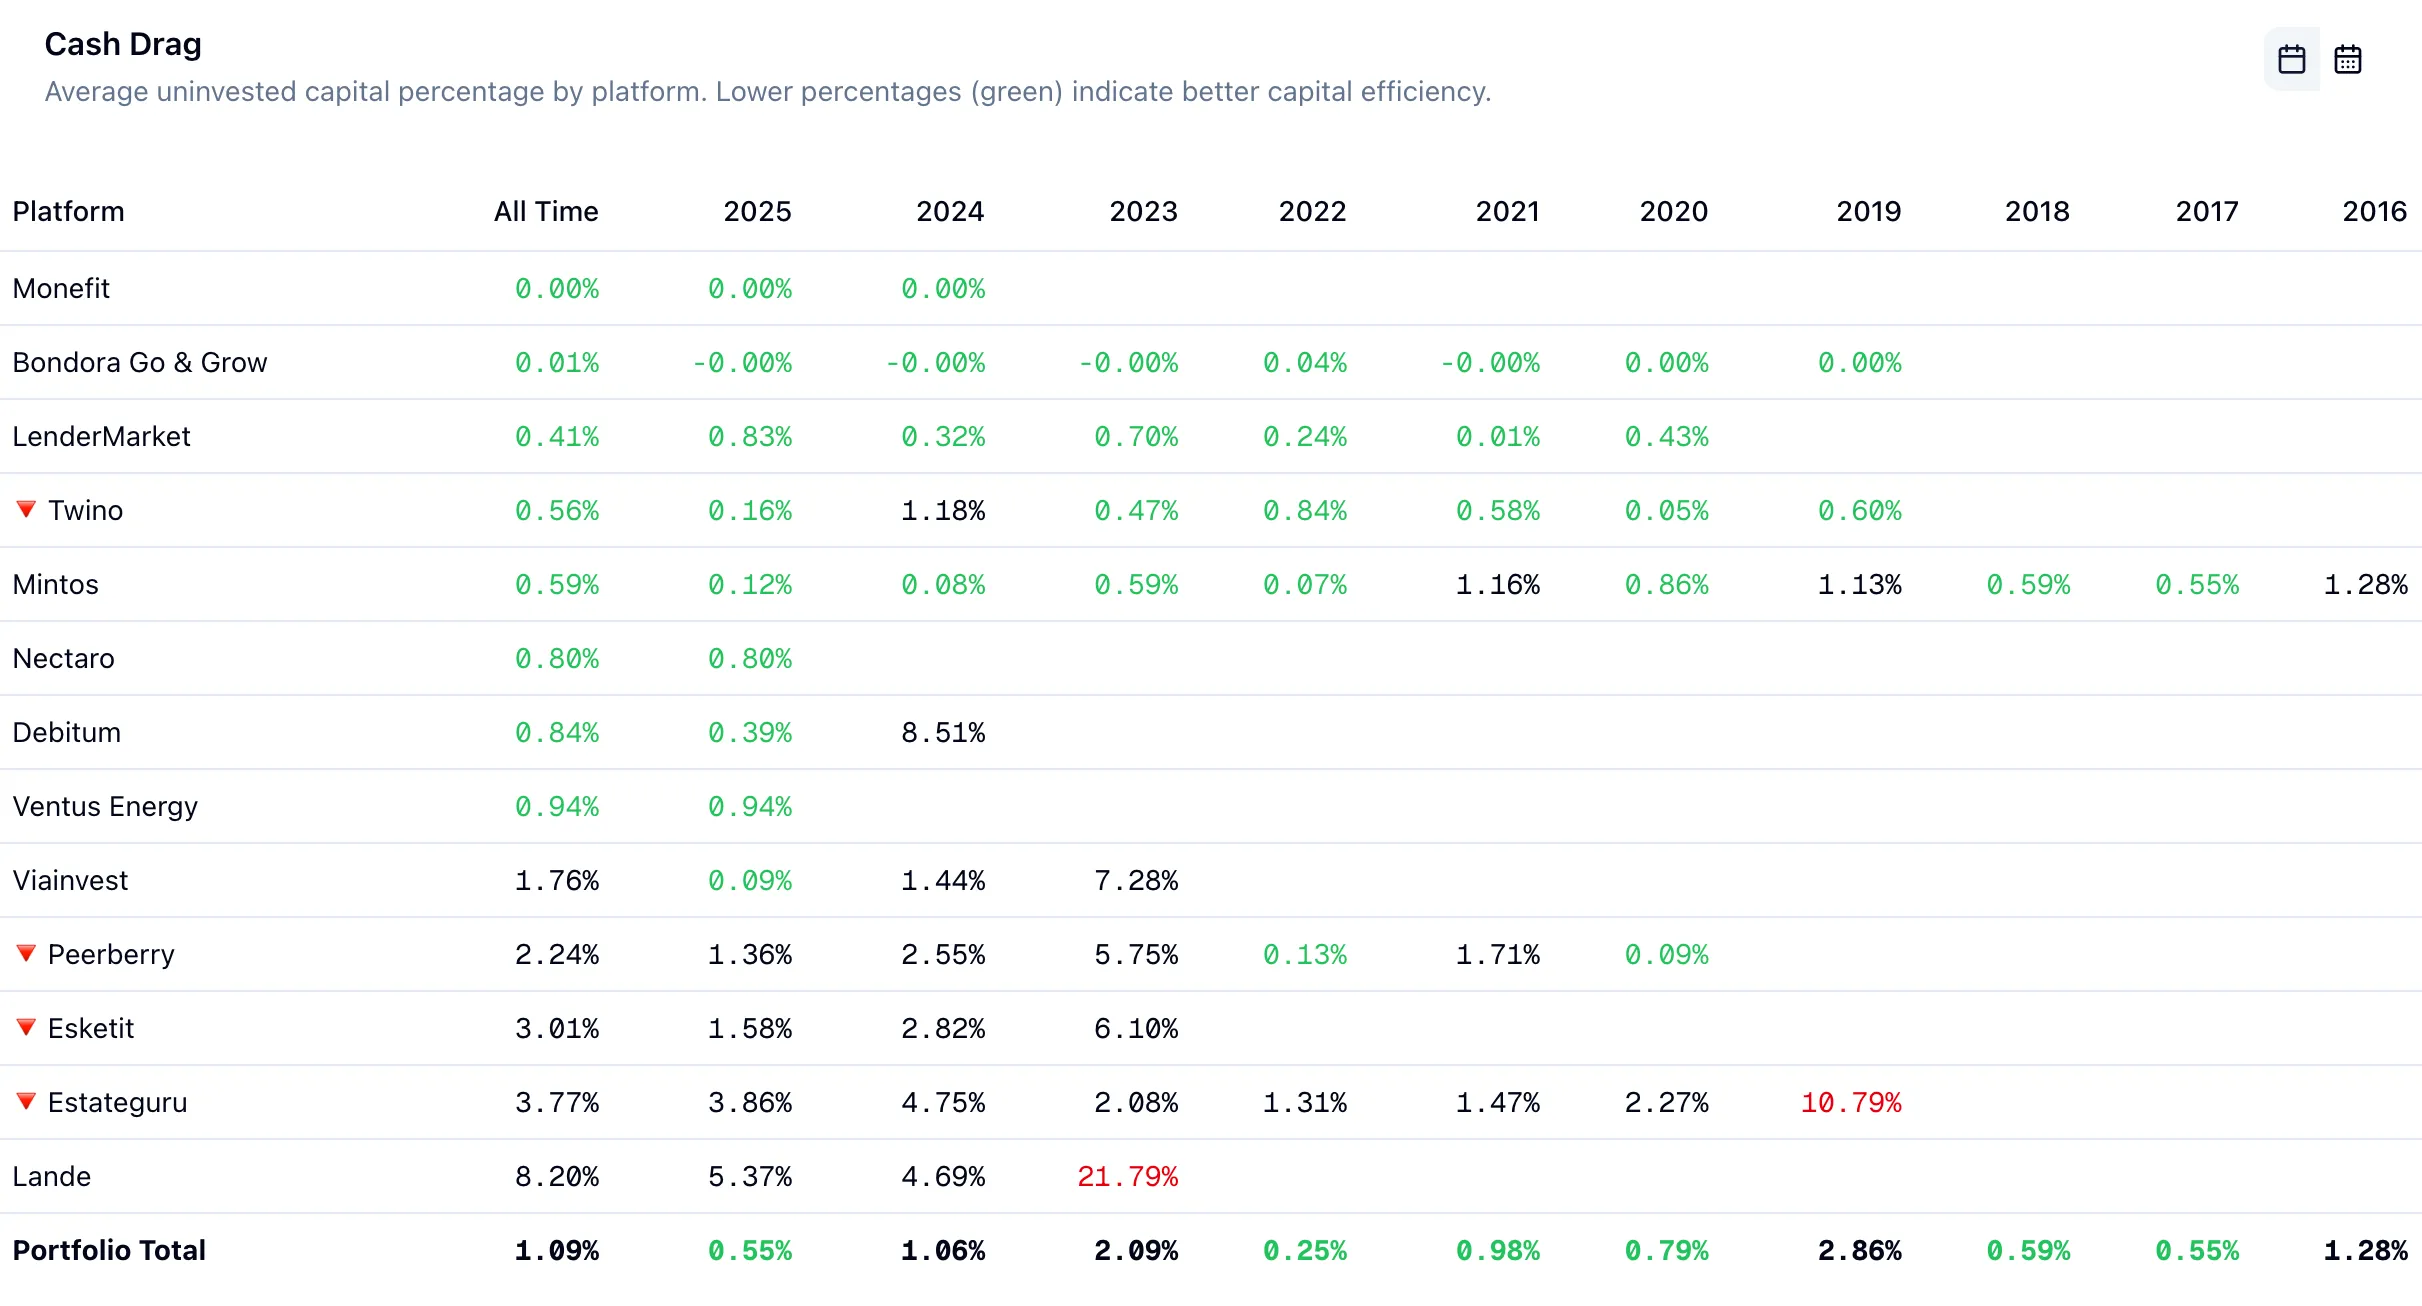
Cash drag: what idle money costs you
Money that sits uninvested earns nothing and pulls the return down. Cash drag shows how much of your balance was idle on each platform and what that cost you.
- Uninvested cash per platform
- Its effect on your XIRR
- Where reinvesting is worth a look
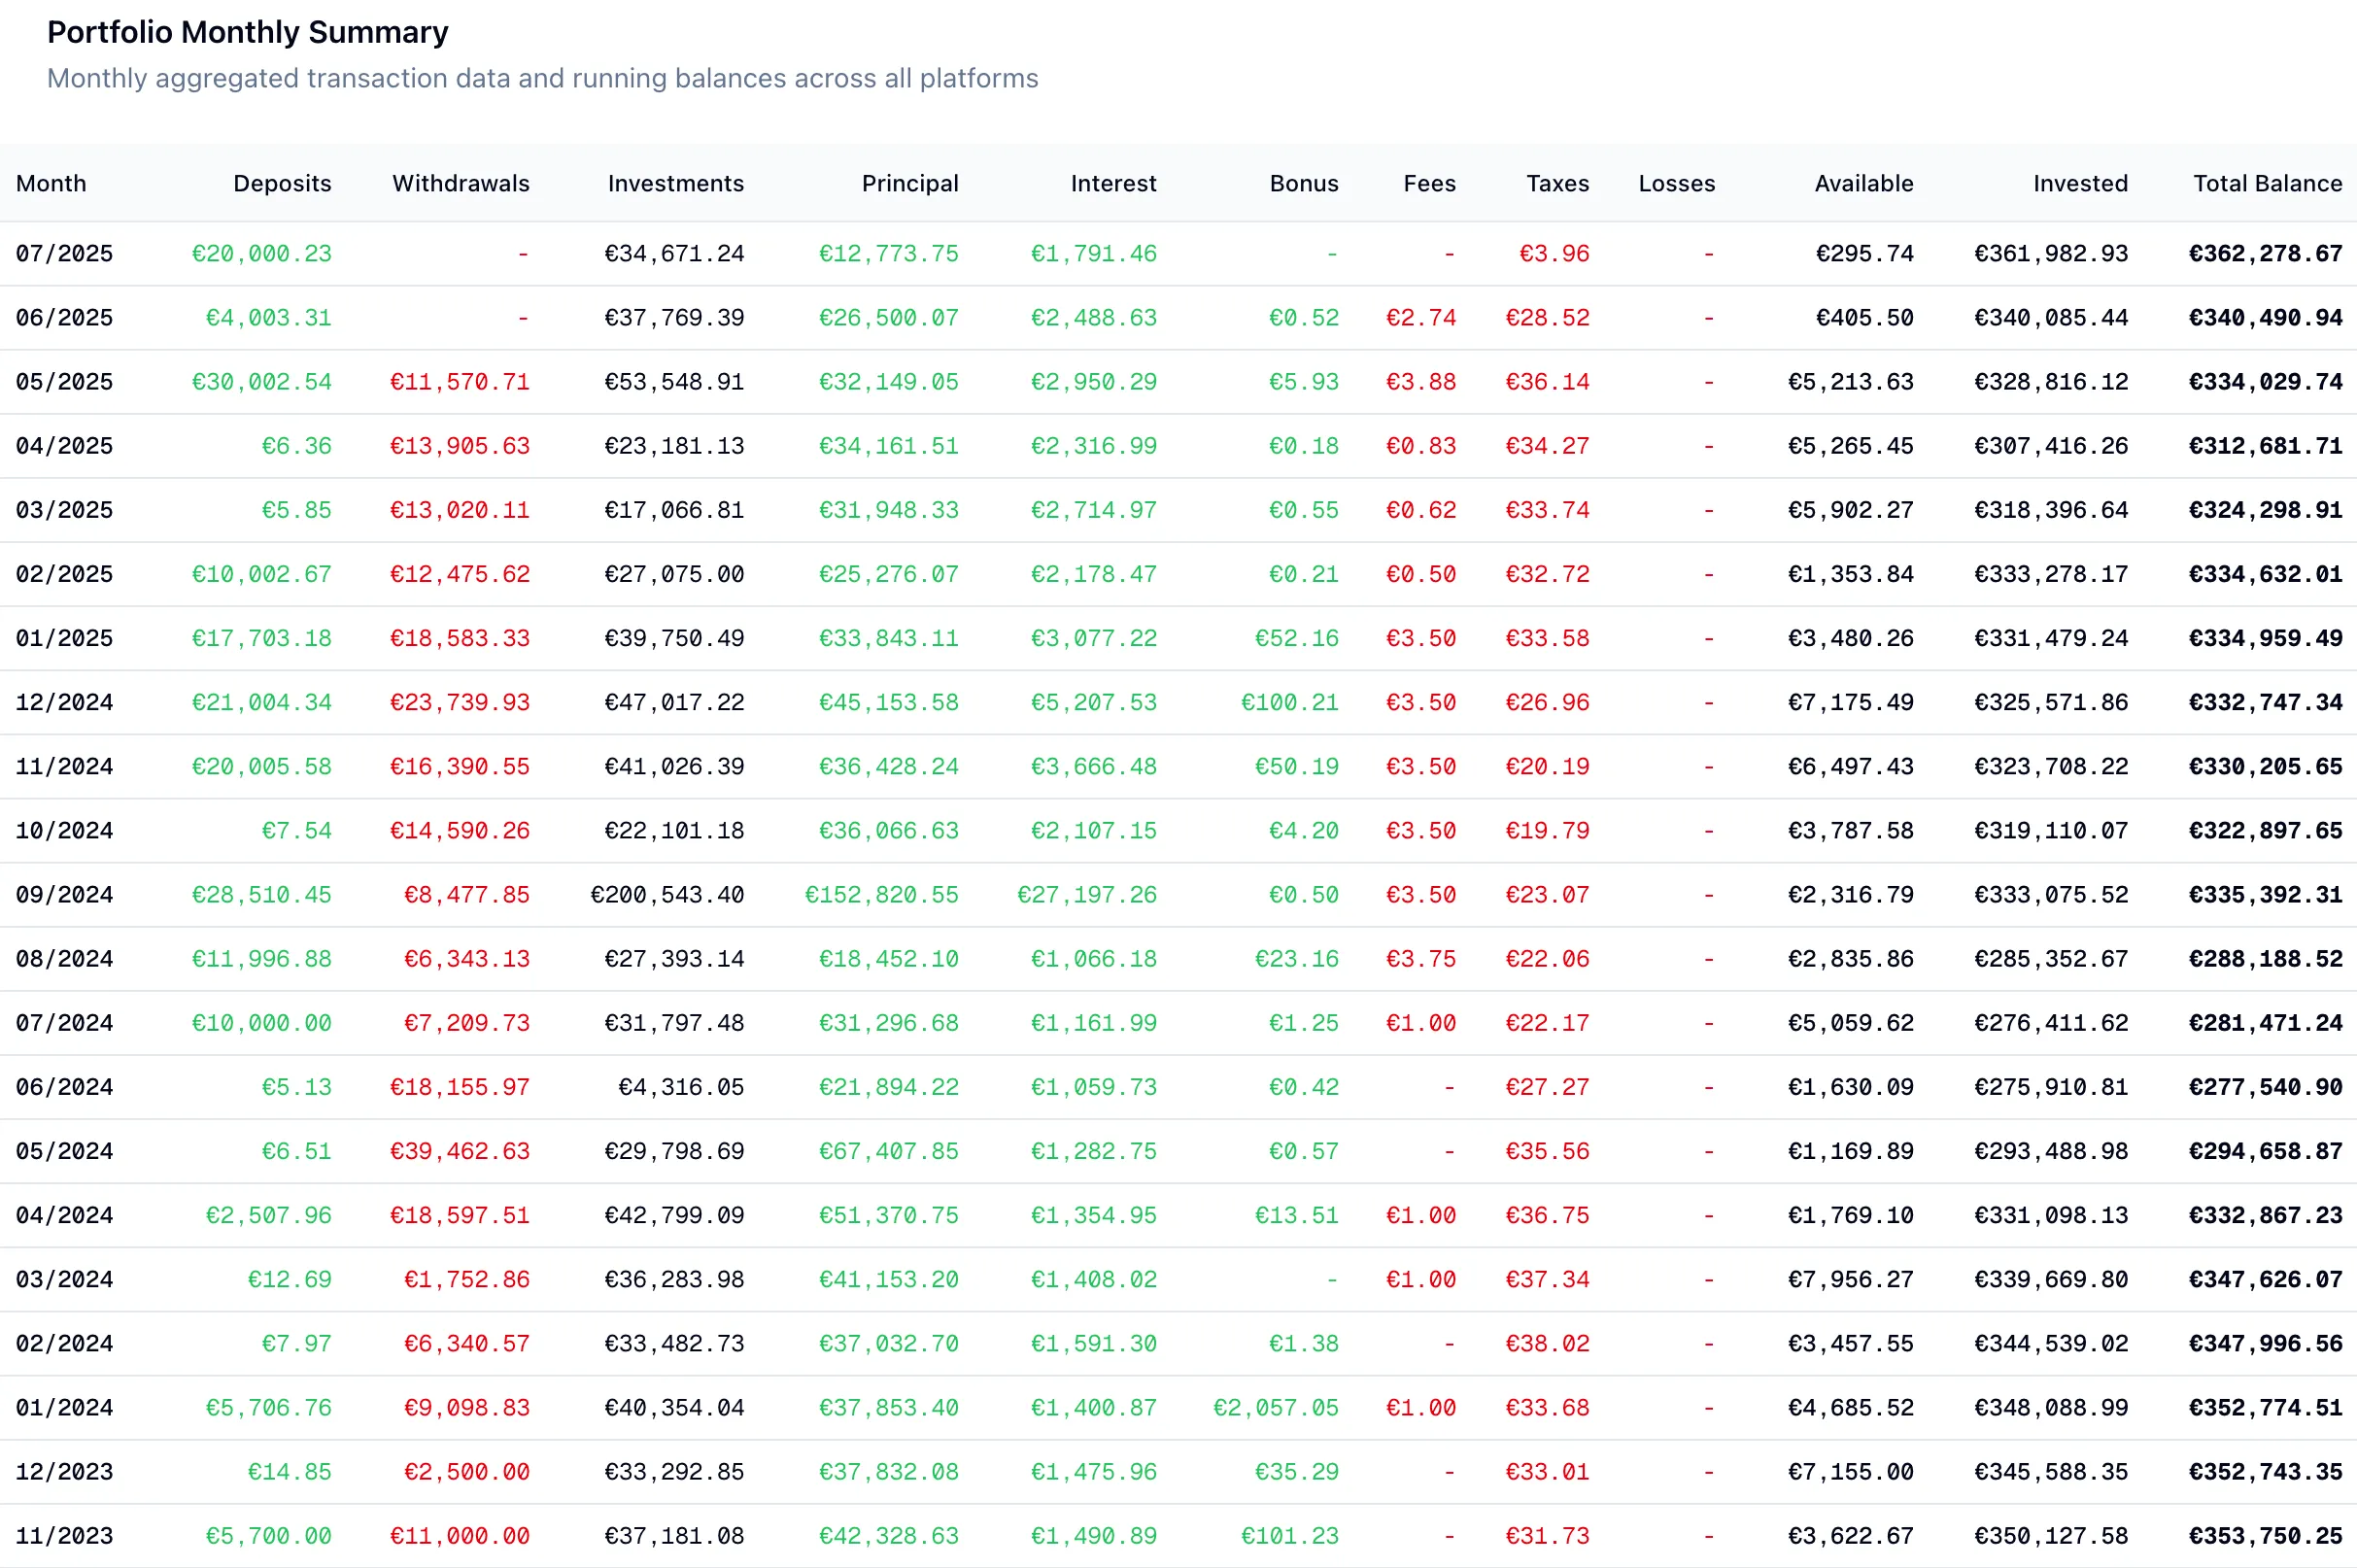
Your portfolio over time
How balance, income and return developed, across all platforms and per platform. Import the full history and the charts go back to your first deposit.
- Balance and return charts over any period
- Monthly and yearly tables
- Full history from every supported platform
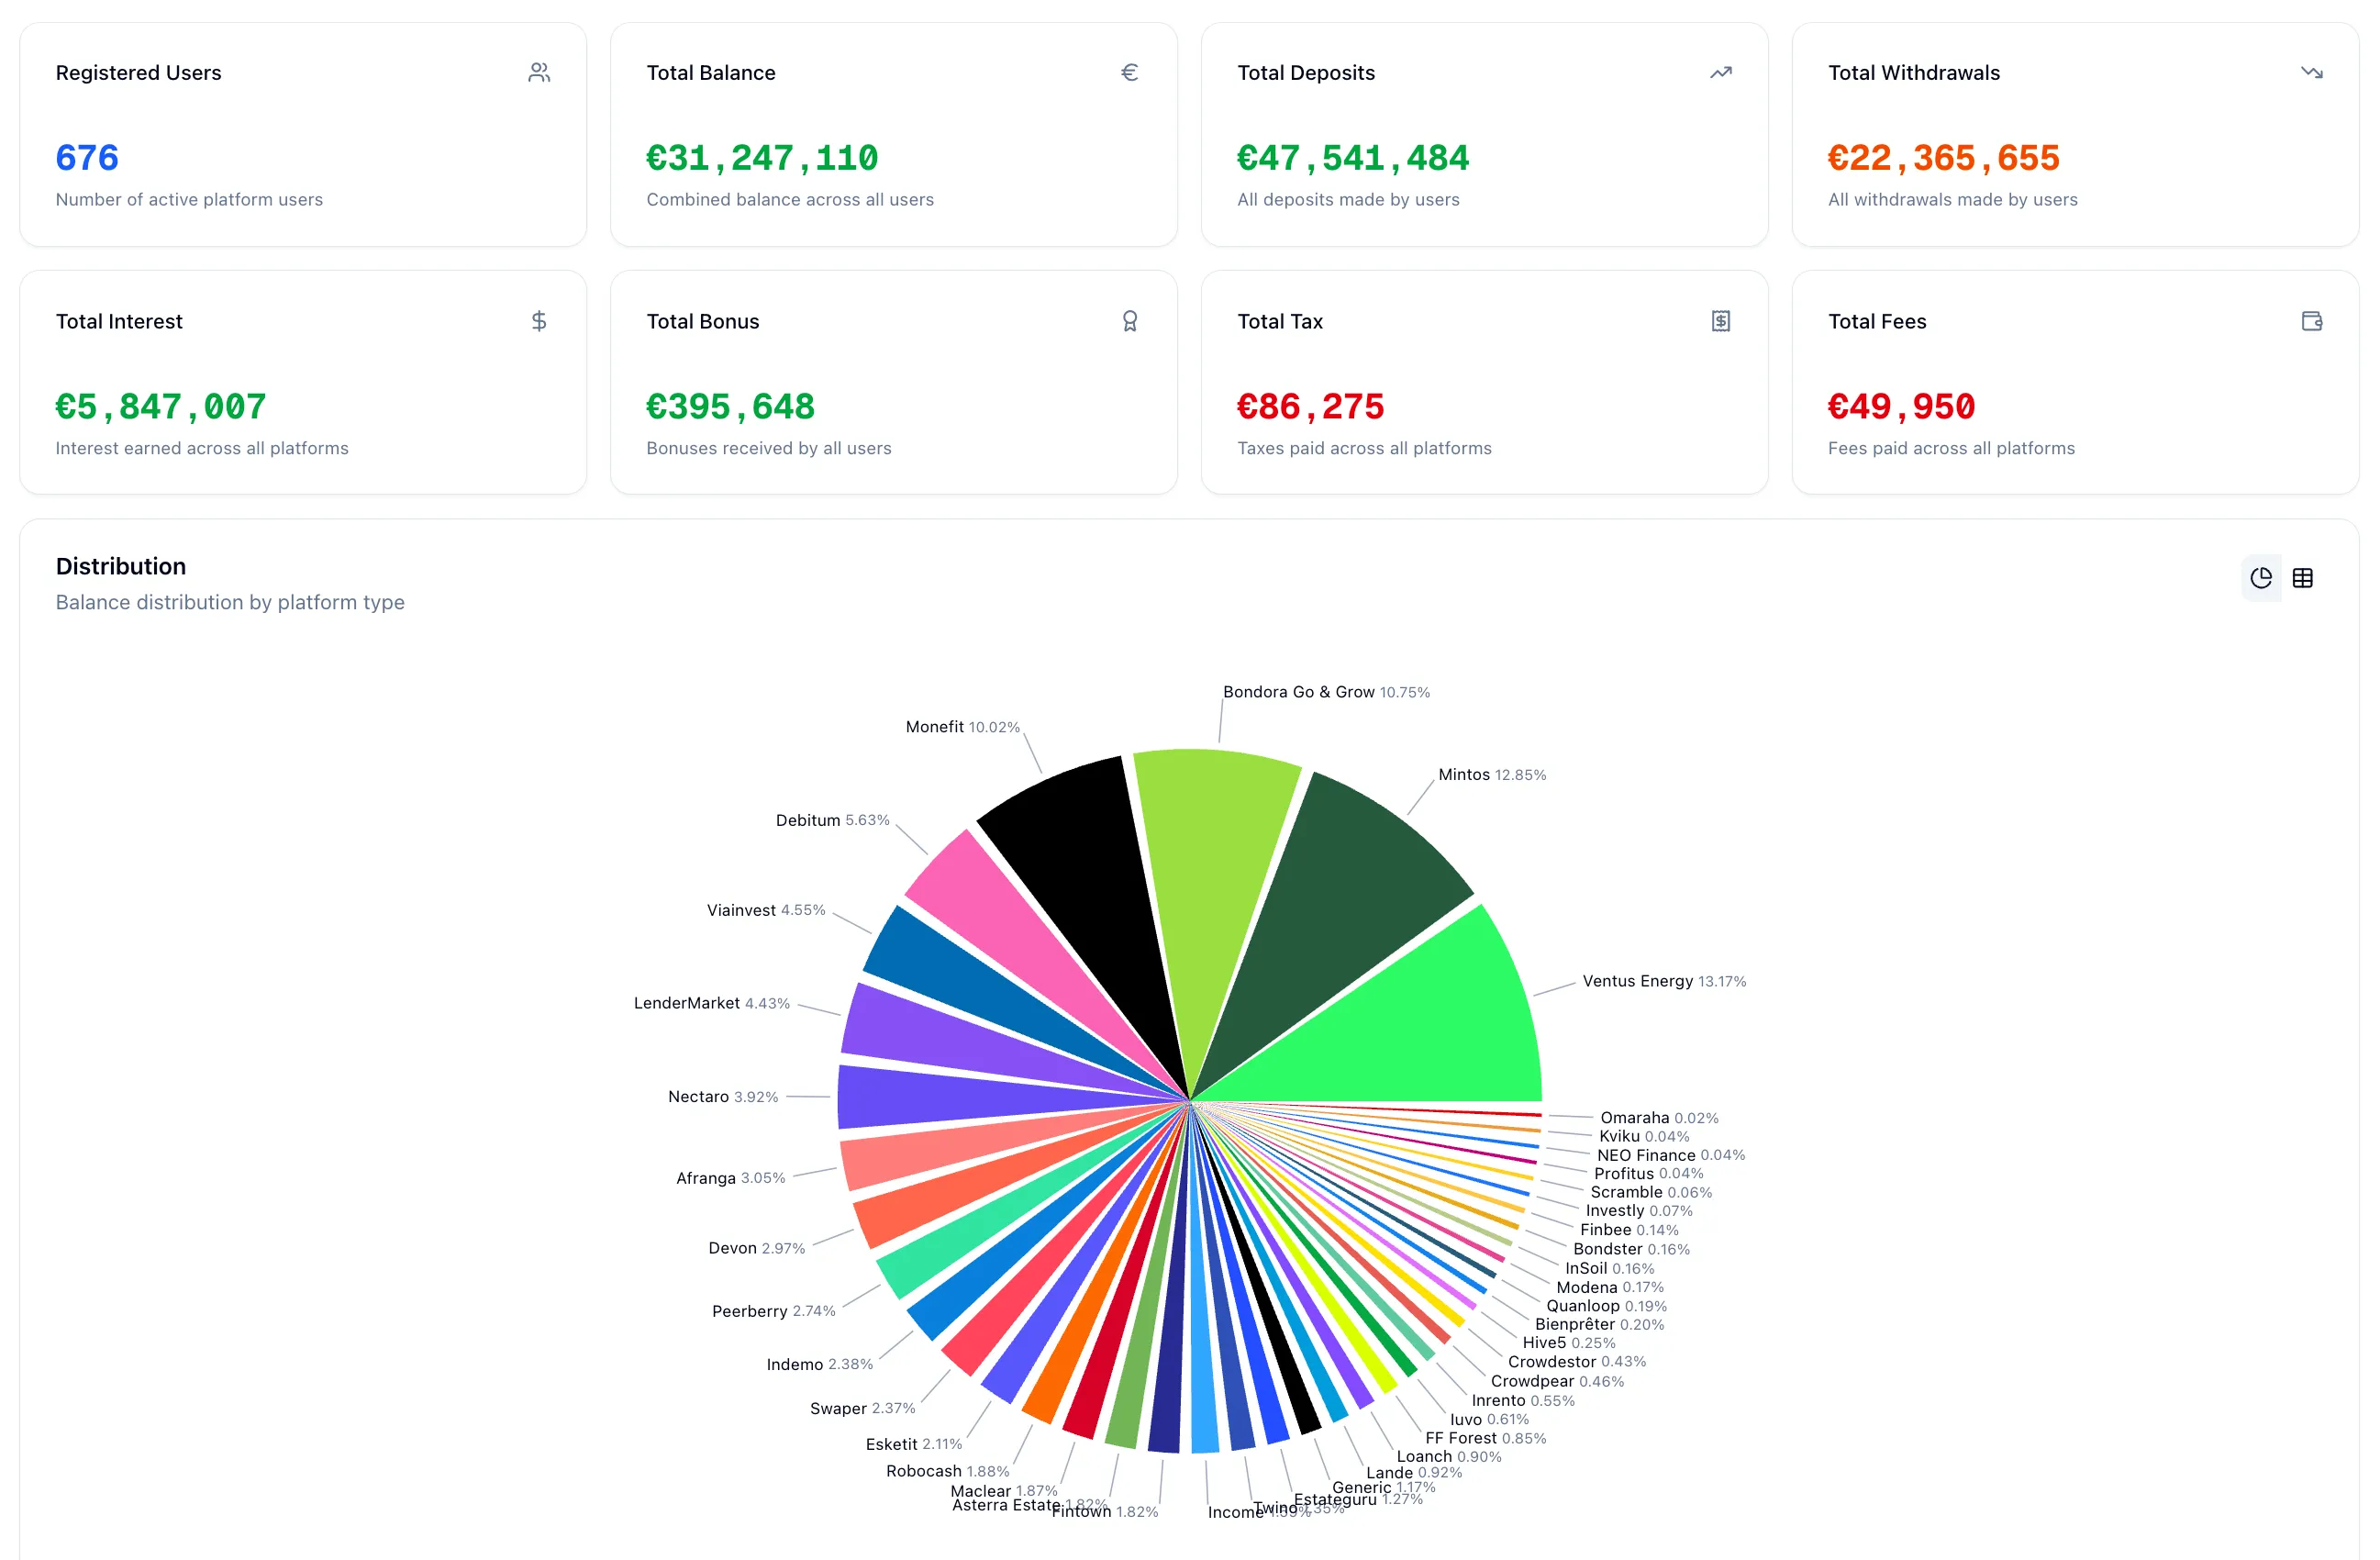
Where you stand among other investors
Anonymous statistics across everyone using P2P Dash. See where your XIRR sits in the distribution and how your money is spread across platforms compared to others.
- Your XIRR against the community distribution
- How your balance is spread across platforms
- Same numbers for every platform, updated nightly
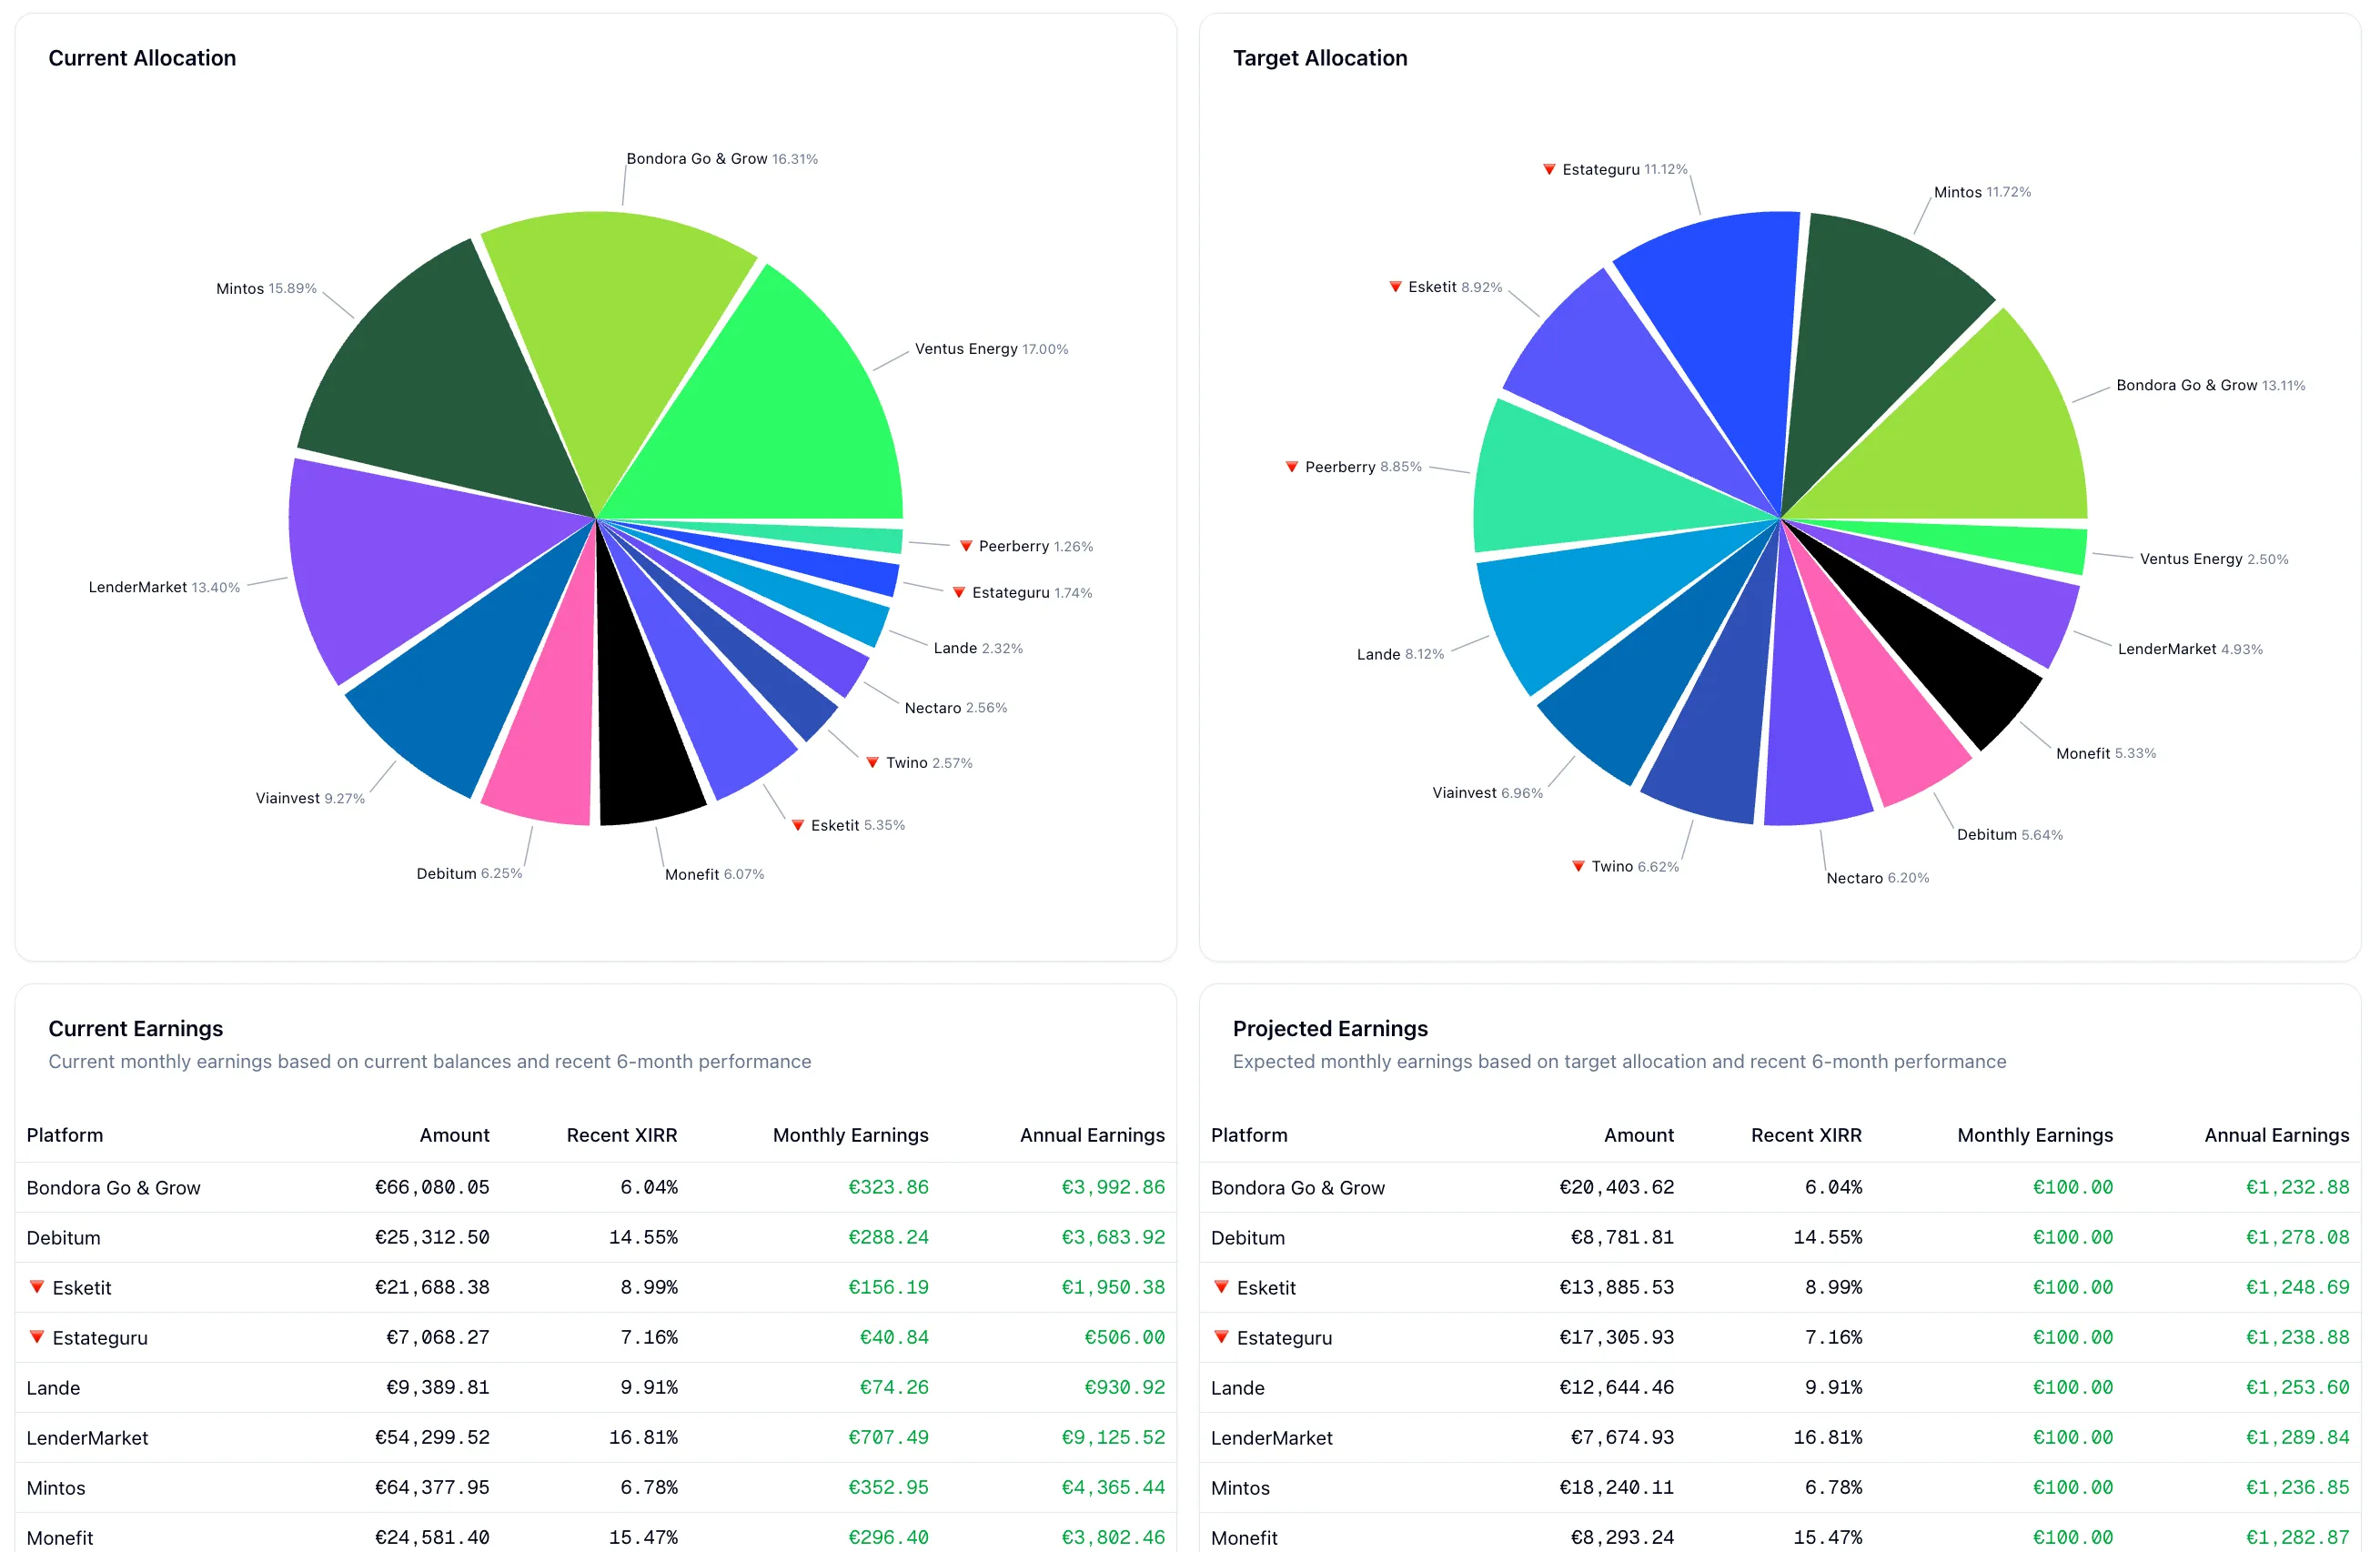
Rebalancing
Set a target share per platform and see how far you are from it. Add a monthly contribution and the projection shows when you get there.
- Target per platform, as an amount or a percentage
- The exact amount to move or add per platform
- Projection with monthly contributions and compounding
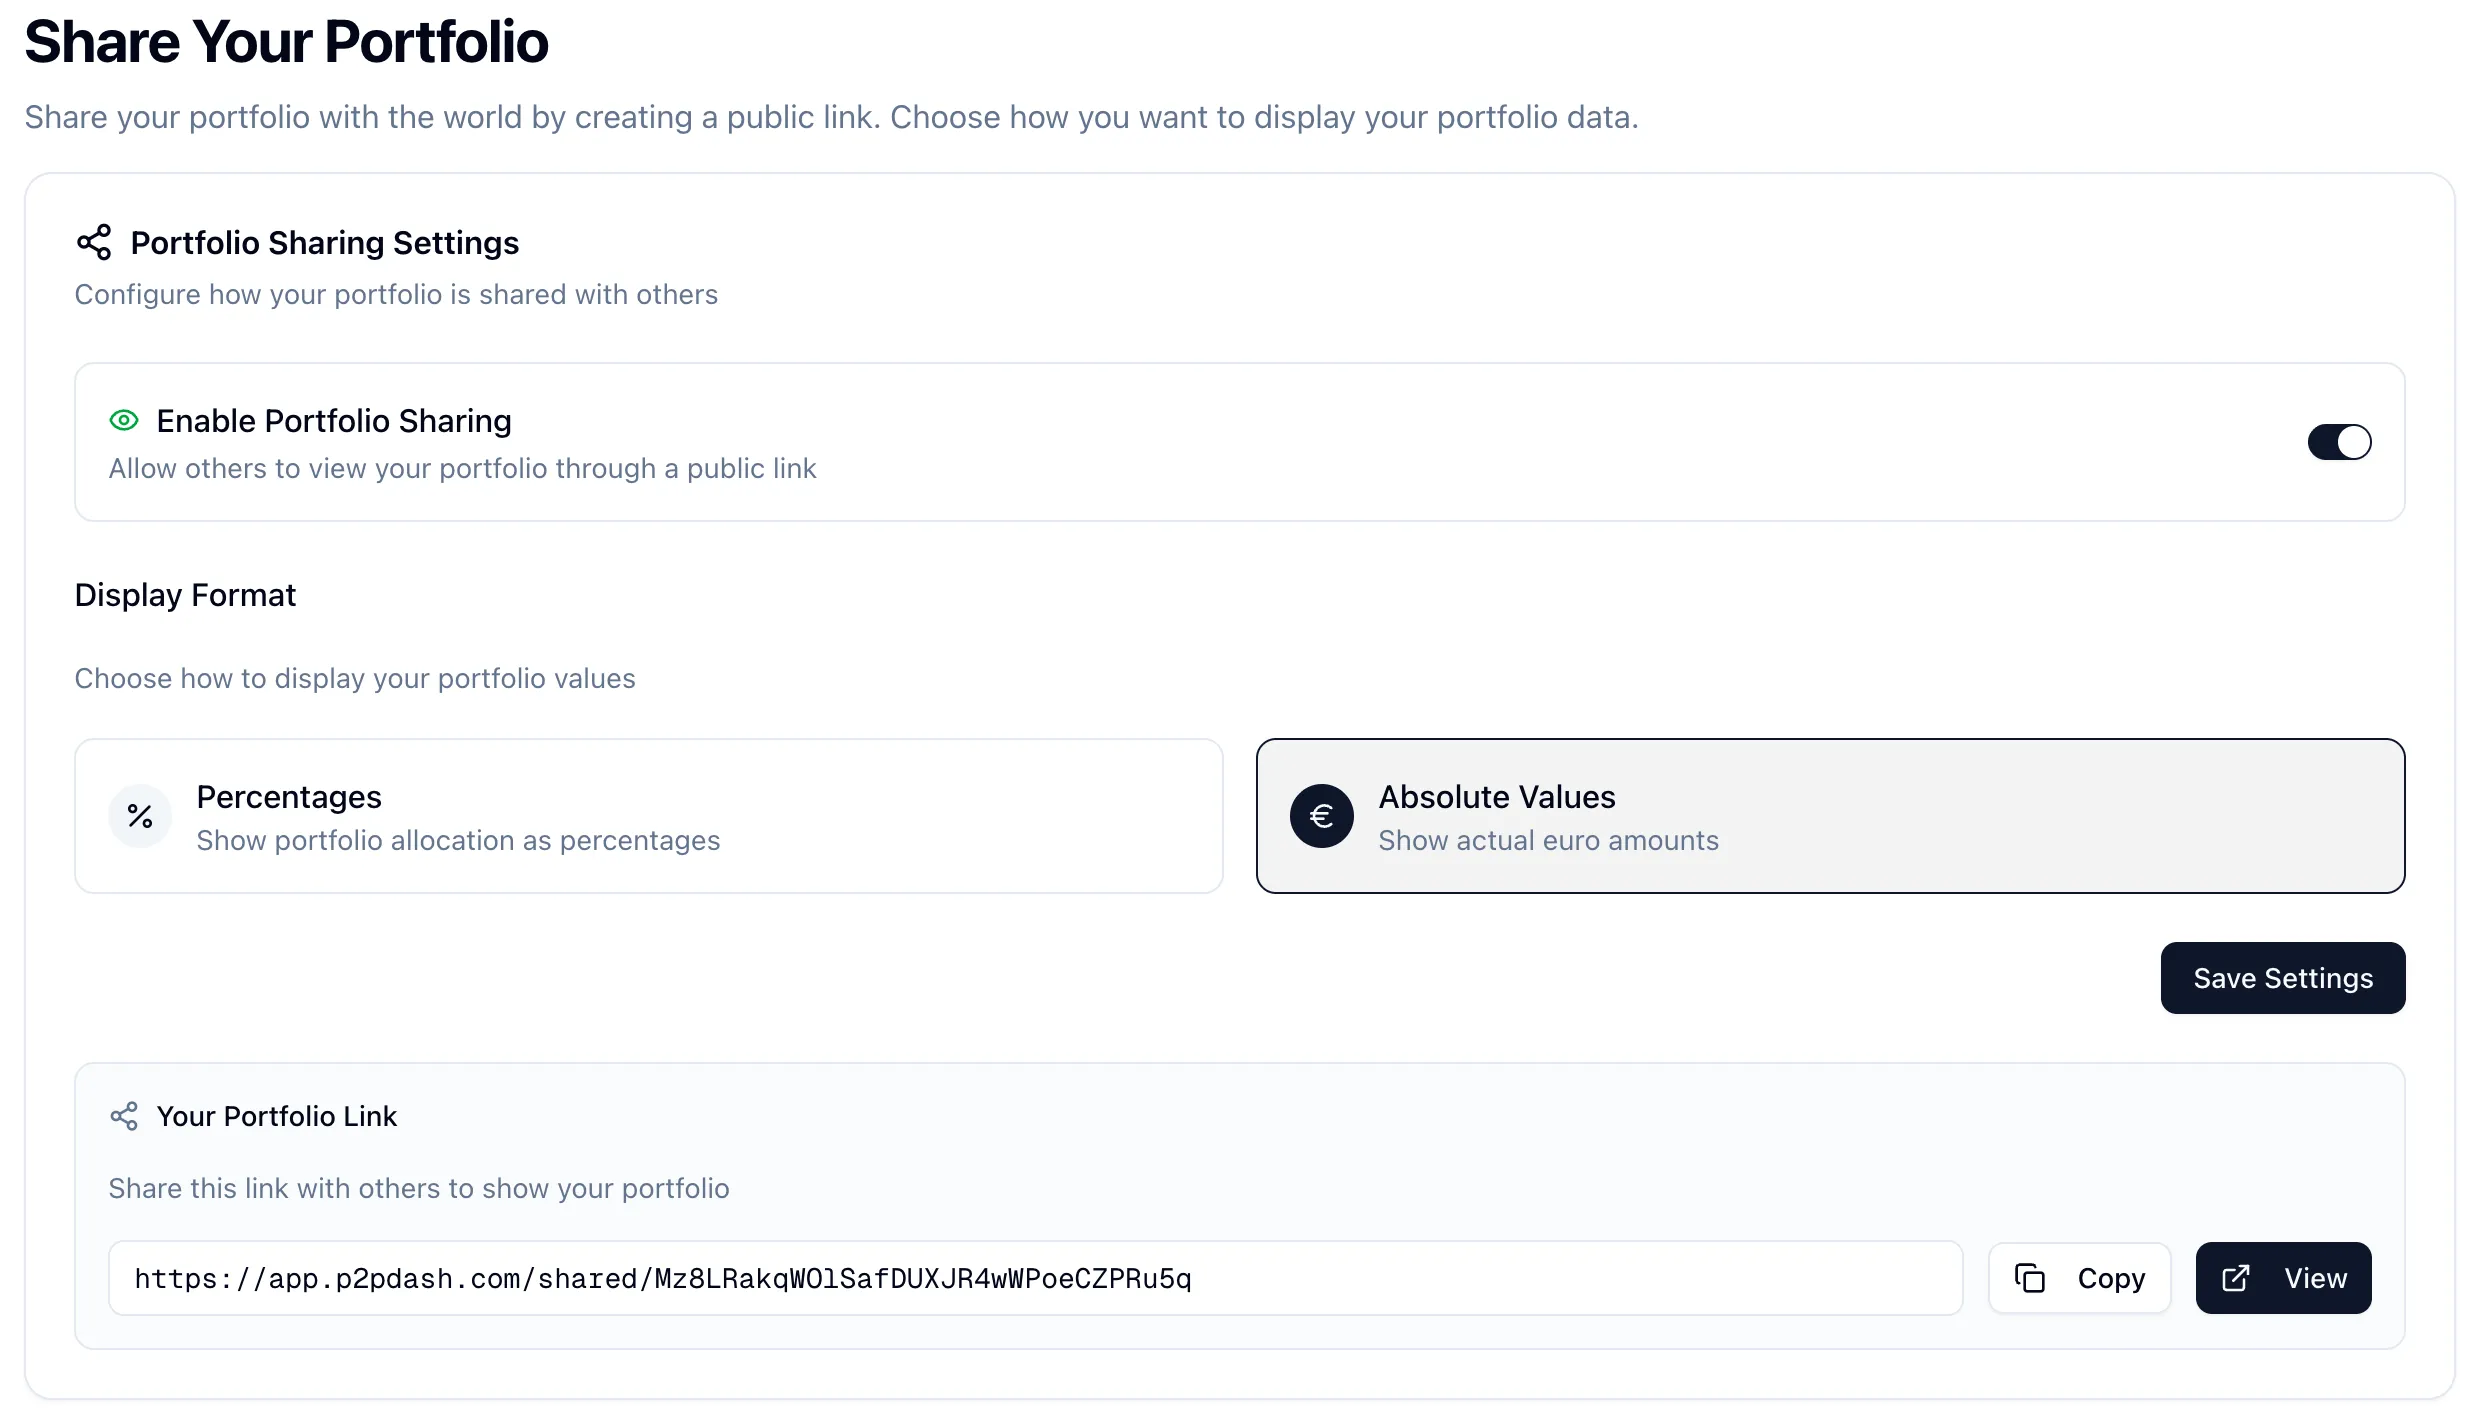
Share your portfolio
A public link to your dashboard, for friends, a forum thread or your readers. You choose whether it shows amounts or only percentages.
- One link, switched on and off by you
- Amounts or percentages only
- Works for single portfolios too
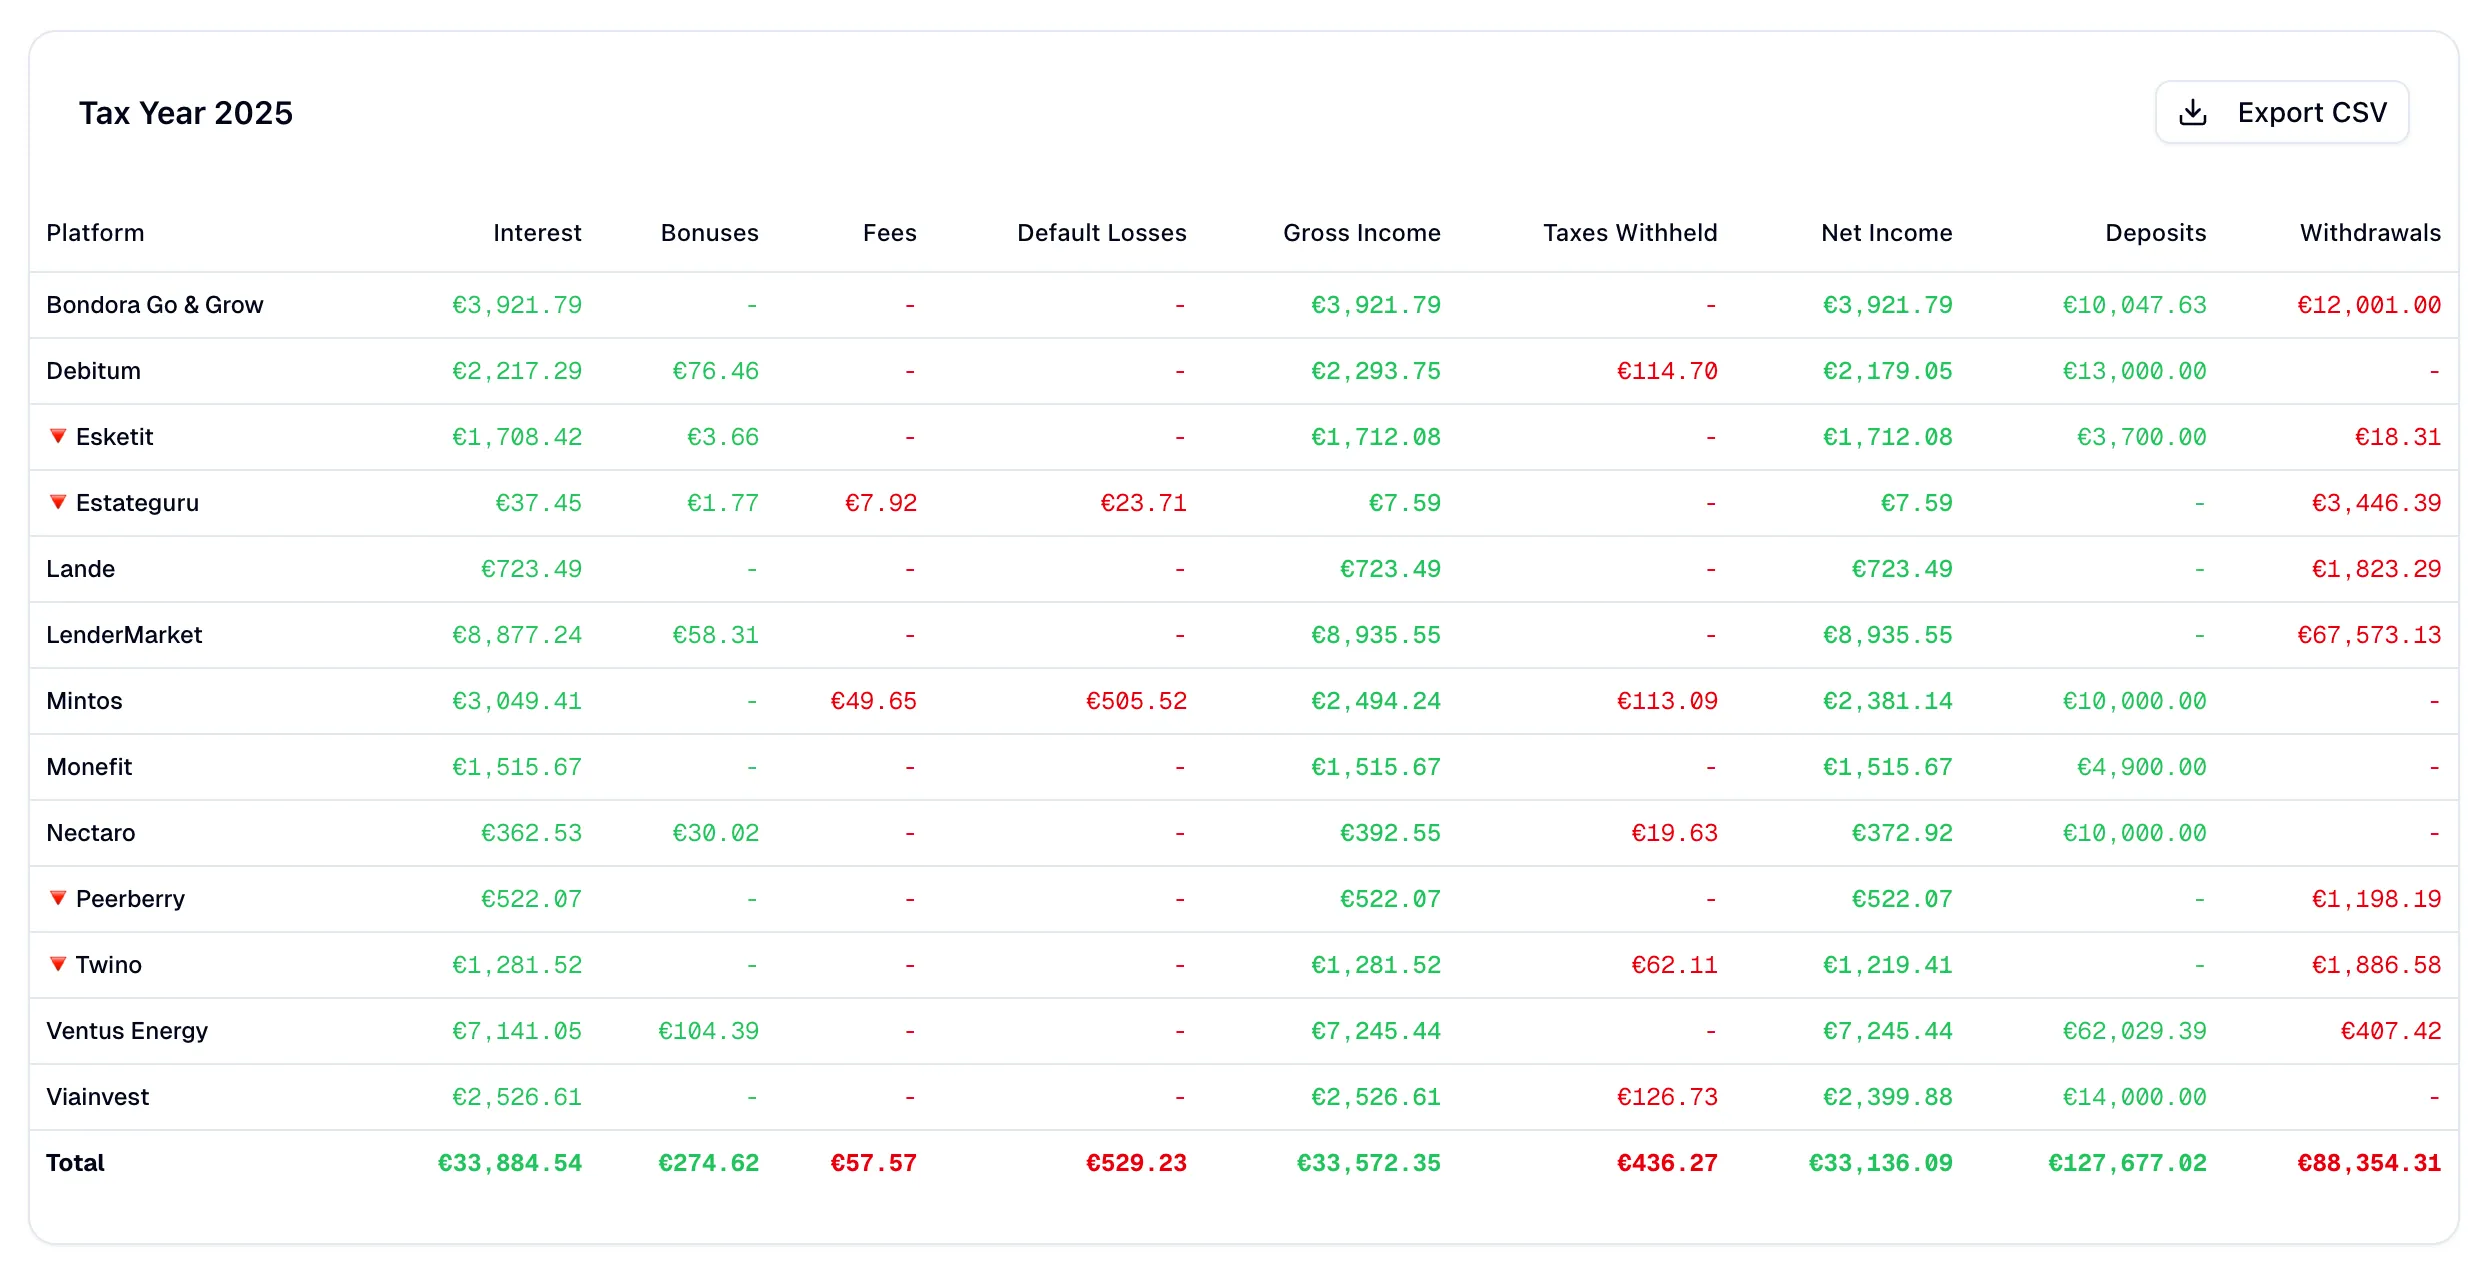
Tax overview
Interest, fees and withholding tax per platform and year, so you know what to expect before you open the official statements. It is an overview, not tax advice: file with the documents from each platform.
- Income per platform and year
- Interest, fees and withholding tax separated
- The numbers to check the official statements against
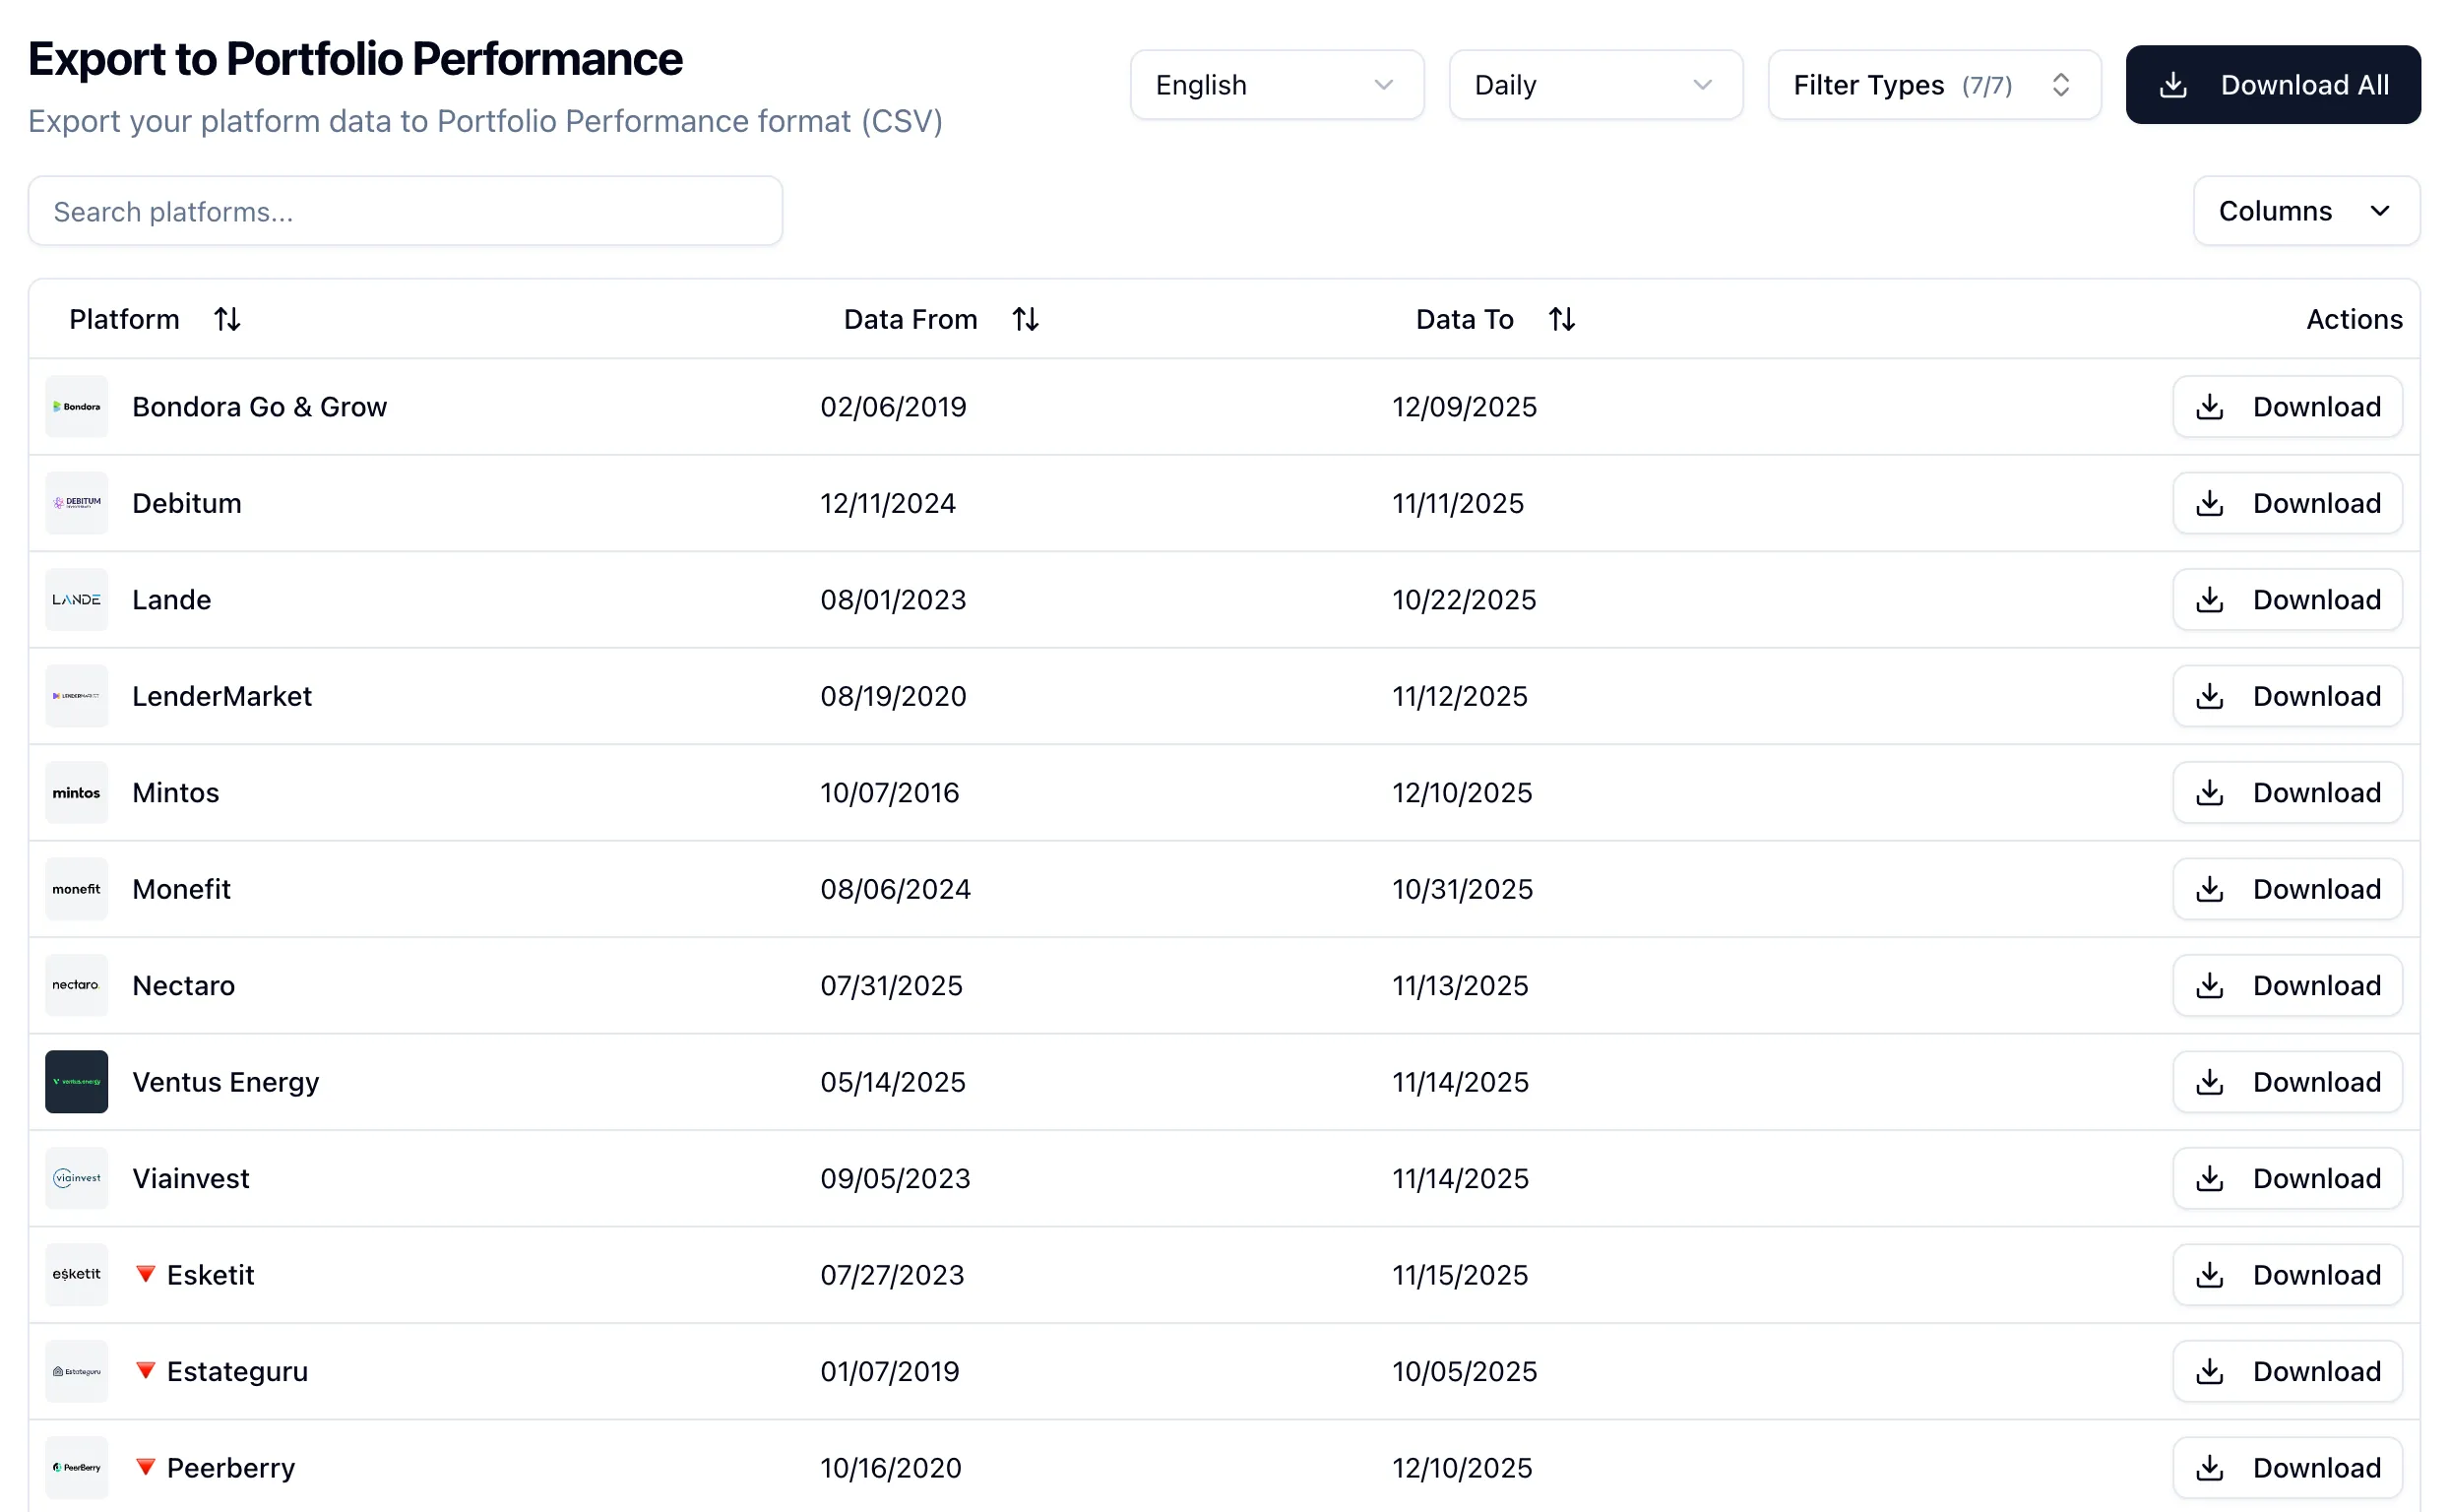
Export to Portfolio Performance
If Portfolio Performance holds the rest of your investments, the P2P part can go there too. The export is a CSV in the format its importer expects, with the transaction types already mapped.
- CSV that Portfolio Performance imports directly
- Transaction types mapped for you
- German and English column names
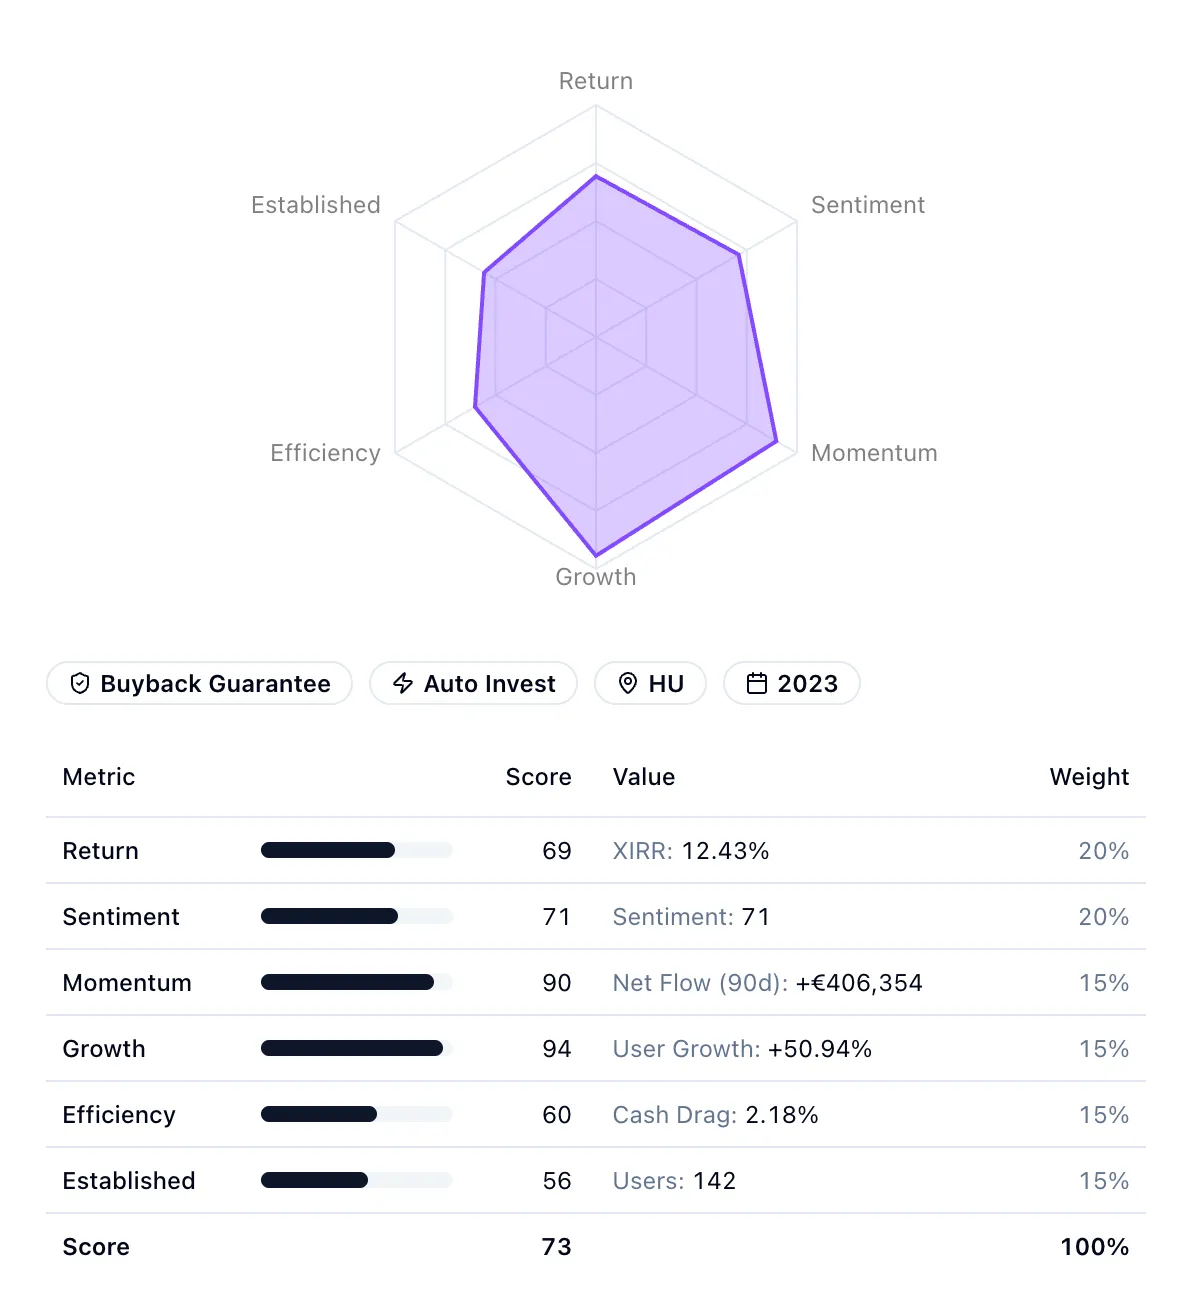
Find your next platform
Platforms ranked by what investors on P2P Dash actually earned and did, not by opinions. Switch the view between trending, stability and balanced.
- Ranking from six measured metrics
- Trending, stability or balanced view
- Platforms side by side in a radar chart
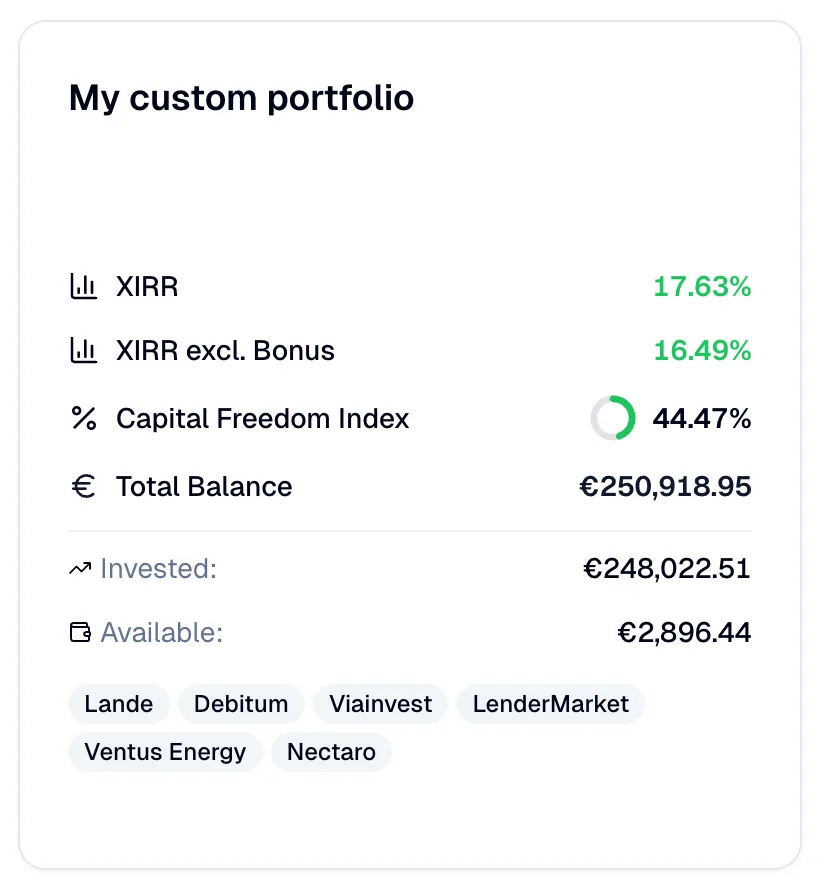
Several portfolios
Group platforms into portfolios, by strategy, risk or goal, and look at each on its own. Every portfolio gets the full set of numbers.
- Any combination of platforms, named by you
- XIRR, cash drag, income and balance per portfolio
- A public link per portfolio if you want one
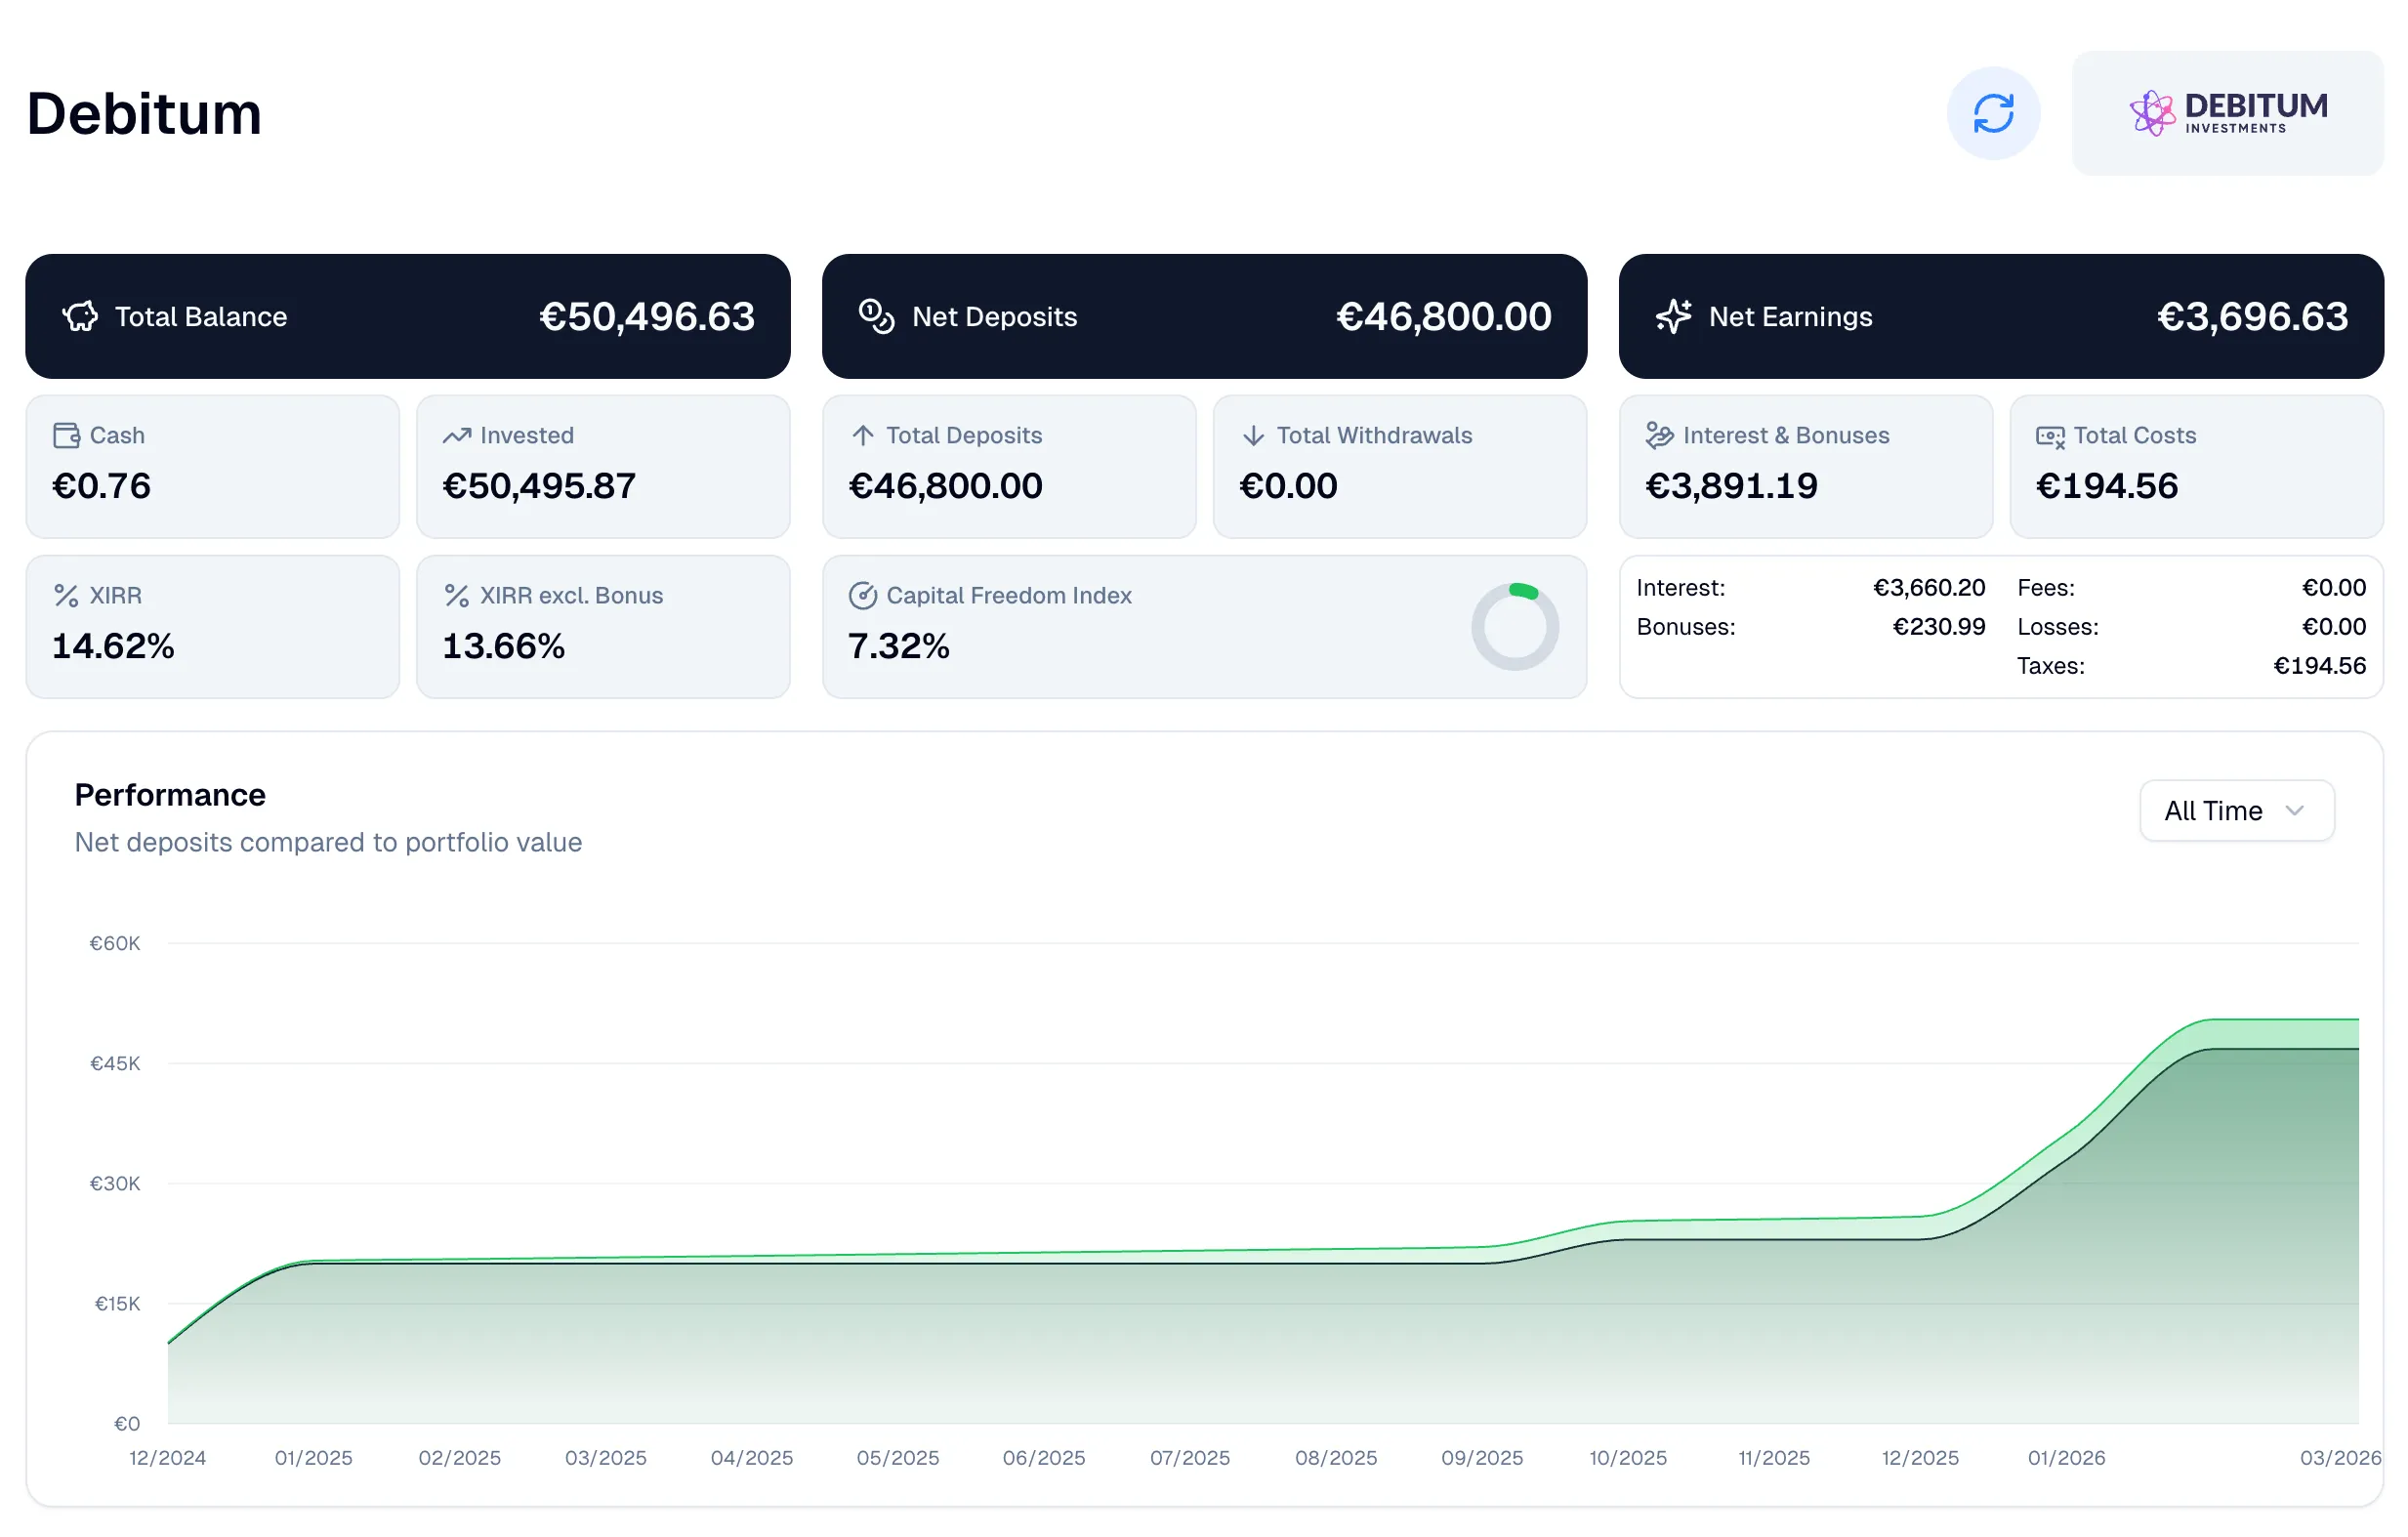
One page per platform
Every platform has its own page with the same charts as the portfolio: balance, income, cash flow, XIRR and cash drag by month and year, plus the transaction list.
- Balance, income and cash flow charts per platform
- XIRR and cash drag by month and year
- Statements and the full transaction list

Community statistics per platform
Anonymous numbers across everyone tracking a platform on P2P Dash: how many investors, how much money, what XIRR they got, and how that changed. Your own position is marked.
- Investors and tracked volume per platform, over time
- XIRR and balance distributions with your position marked
- Income and cash flow across the community
What you plan per platform
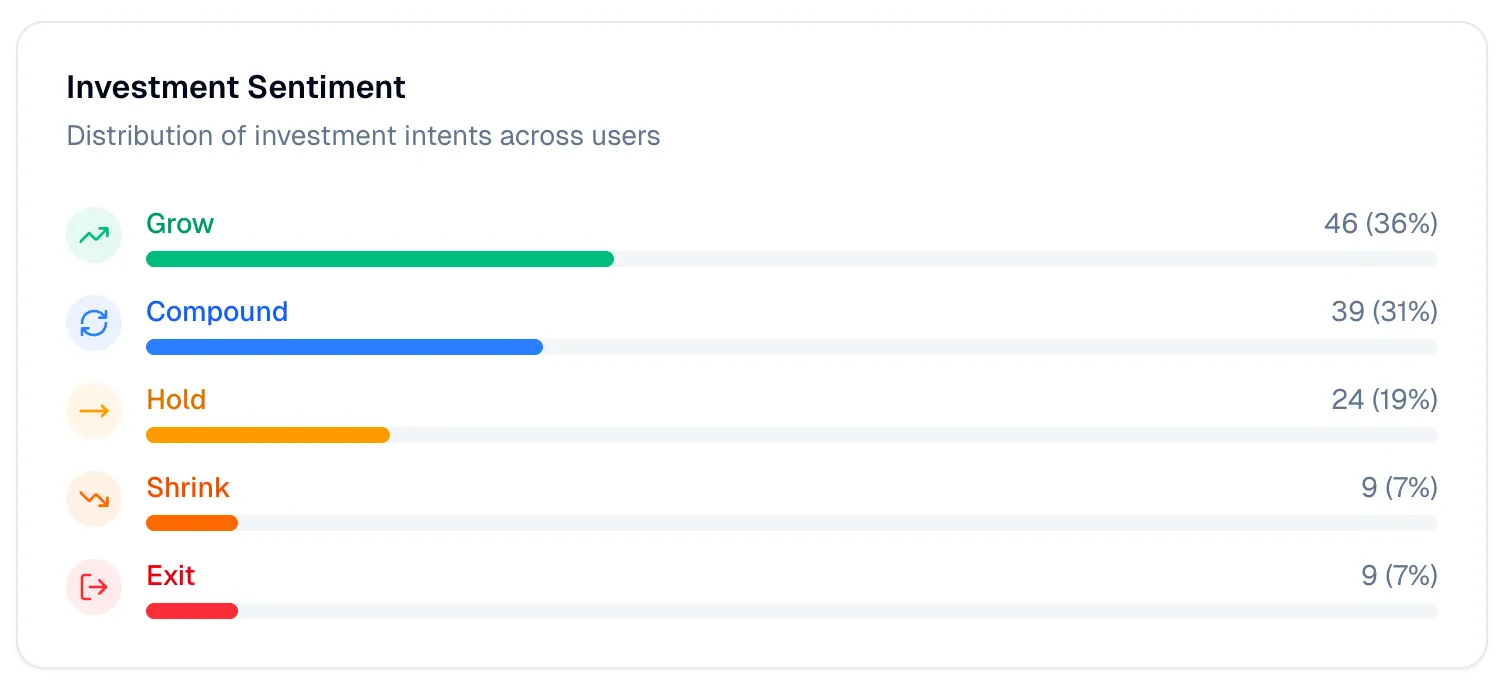
Mark for each platform whether you are growing, compounding, holding, shrinking or exiting. It keeps your own plan visible, and across all investors it shows where the mood is heading.
- Grow, compound, hold, shrink or exit, per platform
- Shown on every platform page
- How all investors on P2P Dash lean, per platform
Manual entries
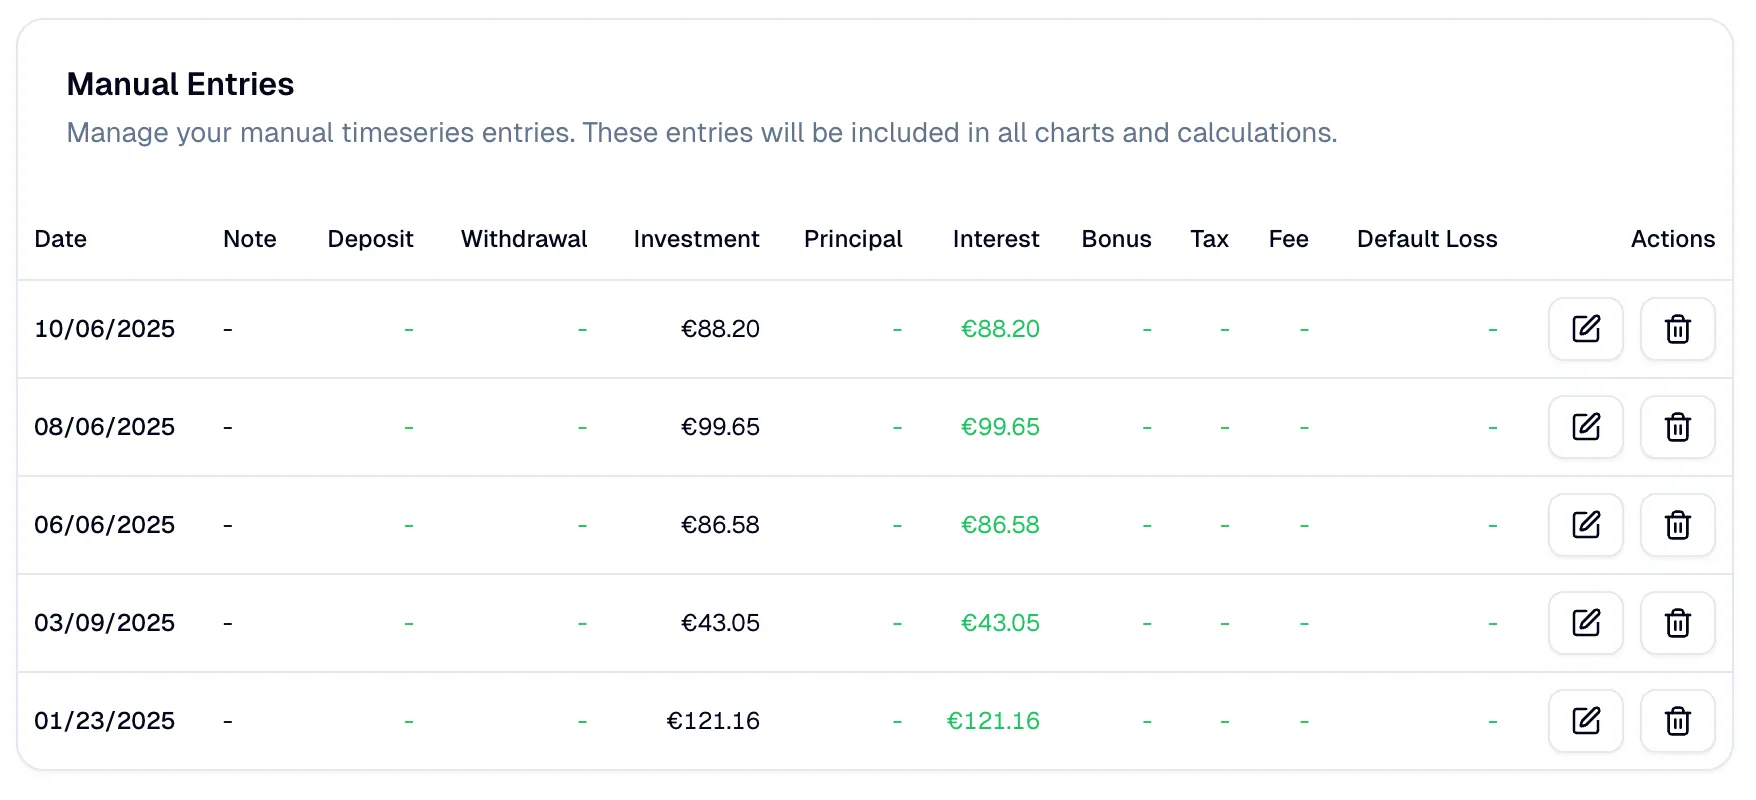
For what the import cannot cover: a platform without an export, a bonus that never showed up in a file. Add deposits, withdrawals, interest and other types by hand, and they count like imported rows.
- Any transaction type: interest, deposits, fees and more
- Edit or delete an entry at any time
- Included in every chart, XIRR and report
See what your P2P portfolio really earns
Upload your first export and the dashboard is ready a few minutes later. Free, and no platform login needed.